
You open your site and, instead of the page, you see a white screen with 502 Bad Gateway, 504 Gateway Time-out, 403 Forbidden or 500 Internal Server Error. The error number looks scary, but it actually tells you quite precisely which part of the path from the browser to the site broke, and the real cause is written in the Nginx log in a single line. In this article we will look at how that path works, learn to find the cause in a couple of minutes and fix each of the four errors one by one, using the examples that come up most often. We reproduced all the examples on a test server with Debian 12, with Nginx version 1.22.1 at the time of testing and PHP 8.2.34.
How the path from the browser to the site works
When a visitor opens a page, their browser sends a request to the web server, that is, to Nginx. If an ordinary image or a ready-made HTML page is needed, Nginx simply takes the file from the disk and serves it. But most sites consist of more than files. The page has to be assembled, for example by querying a database, and a separate program called the backend does that. It can be PHP-FPM running your WordPress scripts, or an application in Python or Node.js that listens on its own port. In this setup Nginx acts as a doorman. It accepts the request, passes it to the backend, waits for the response and forwards it to the browser. That is why two of the four errors have the word "Gateway" in their names, because at that moment Nginx stands as a gateway between the visitor and the application.
The first digit of the code shows which side failed. Code 403 belongs to the 4xx family, that is, requests that cannot be fulfilled the way they arrived. Nginx understood perfectly well what the browser wants, but refused to serve a response, because there is nothing to show or it has no rights to read the required files. Codes of the 5xx family mean a failure on the server side. Code 500 says that something broke while handling the request, most often in the script or application itself. Code 502 means that Nginx did not get a meaningful response from the backend, for example because the backend is not running. Code 504 means that the backend is reachable but did not answer within the allotted time. So for any of these errors you first need to work out at which link of the chain the break happened.
The code names the link but not the cause, and the cause has to be found in the log. Take, for example, a situation where PHP-FPM has stopped. The browser still contacts Nginx, Nginx tries to pass the request to the PHP-FPM socket but cannot connect, so it draws a short 502 page itself with its version number at the bottom, and writes into the log exactly what it failed to connect to. If PHP-FPM is running but the script crashed with a fatal error, Nginx gets a response with code 500 and an empty body from it and honestly passes it on, and the error message is then drawn by the browser itself. We saw both pictures on the test server, and from the look of the page you can guess who produced it, Nginx or the application. Still, the exact answer is in the error log, which we will turn to now.
What you will need
- A server with Debian 12 where Nginx is already running, for example the DE-RZ9-1 plan. The examples in this article are very light, and the article about VPS will help you choose a plan that suits your site. If you don't have a server yet, order one following the instructions.
- An SSH connection, for example through Termius. The commands are run as
root. - Nginx and PHP-FPM. We described how to install them in the article about installing Nginx. PHP-FPM is only needed for the PHP examples.
- A site or application where you see the error.
Addresses and names in the examples
On the test server each example ran on its own port, so in the commands and in the terminal screenshots an address like 127.0.0.1:8091 is used instead of a domain. For your own site, use the domain, for example https://example.com. The errors-demo-… folders and the errors-app service are also made up for this article, and yours will have different names. The browser screenshots were taken from the same test sites, and the example.com domain in the address bar is just a placeholder.
Step 1. Find out the response code
Start with the curl command. It contacts the site the same way a browser does, but shows only what the server actually replied. The -I option asks for the response headers only, and the code is in the very first line.
# Show the response headers, the first line has the code
curl -I https://example.com
If you only need the line with the code, add the -s option and pass the output to the head command.
# Only the first line of the response
curl -sI https://example.com | head -1
A line like HTTP/1.1 502 Bad Gateway confirms that the error came from the server, not from your network or browser. The Server header also shows the Nginx version.
Step 2. Read the Nginx error log
Nginx writes every failure to the /var/log/nginx/error.log file. Open the log in follow mode, and then refresh the page with the error in your browser. A new line will appear at that very moment.
# Follow the log, press Ctrl+C to exit
tail -f /var/log/nginx/error.log
Old lines do not get in the way
The tail -f command first shows the last ten lines of the log and only then waits for new ones. To keep old entries from distracting you, add the -n 0 option, as in the screenshot below.
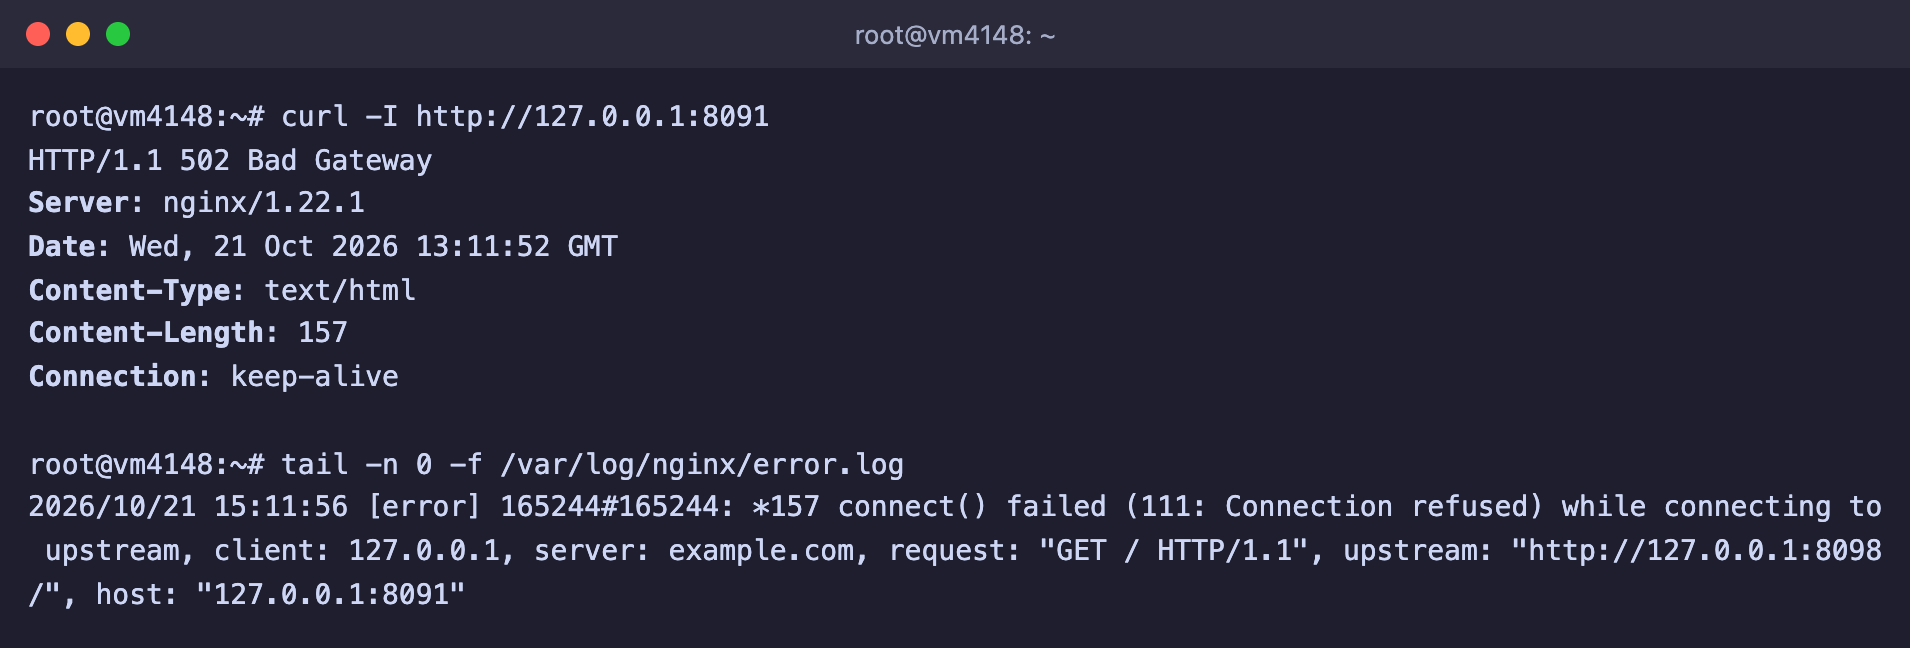
The response code and the log line that explains the cause
Such a line is easy to read. Take the one we got when the application behind Nginx was stopped.
2026/10/21 14:53:33 [error] 124894#124894: *3 connect() failed (111: Connection refused) while connecting to upstream, client: 127.0.0.1, server: example.com, request: "GET / HTTP/1.1", upstream: "http://127.0.0.1:8098/", host: "example.com"- Time and level at the start of the line. The word in square brackets shows how serious the entry is, and we came across
[error]and[crit]. - The essence of the problem right after the process number. Here it is
connect() failed (111: Connection refused), meaning Nginx could not connect because the port is closed. - client shows who made the request, server and host show which site, and request contains the request itself.
- upstream shows exactly where Nginx tried to pass the request. This is the address of the backend, and it hints at which program to check next.
The log is shared by all sites on the server, so with heavy traffic it is handy to look for the entry you need by the page address.
# The latest entries that contain the address you need
grep '/slow' /var/log/nginx/error.log | tail -n 5
You can read more about how to read logs and where they are stored in the article about Linux logs.
Step 3. Check the program behind Nginx
If the log line contains the word upstream, next you need to find out what is happening with the backend. For an application that runs as a systemd service, check its state and the latest messages. Instead of myapp, put the name of your service, and for PHP it will be php8.2-fpm.
# State of the service
systemctl status myapp --no-pager

# Last 50 messages of the service
journalctl -u myapp -n 50 --no-pager

# Who listens on the port you need, replace 8098 with your own
ss -tlnp | grep 8098
The Active line should say active (running). The values failed and inactive (dead) mean the program has stopped, and the service log usually tells you why. The last command shows the programs that listen on ports. An empty answer means nobody listens on that port and Nginx has nobody to pass requests to. How to manage services and read their logs is described in detail in the article about systemd services.
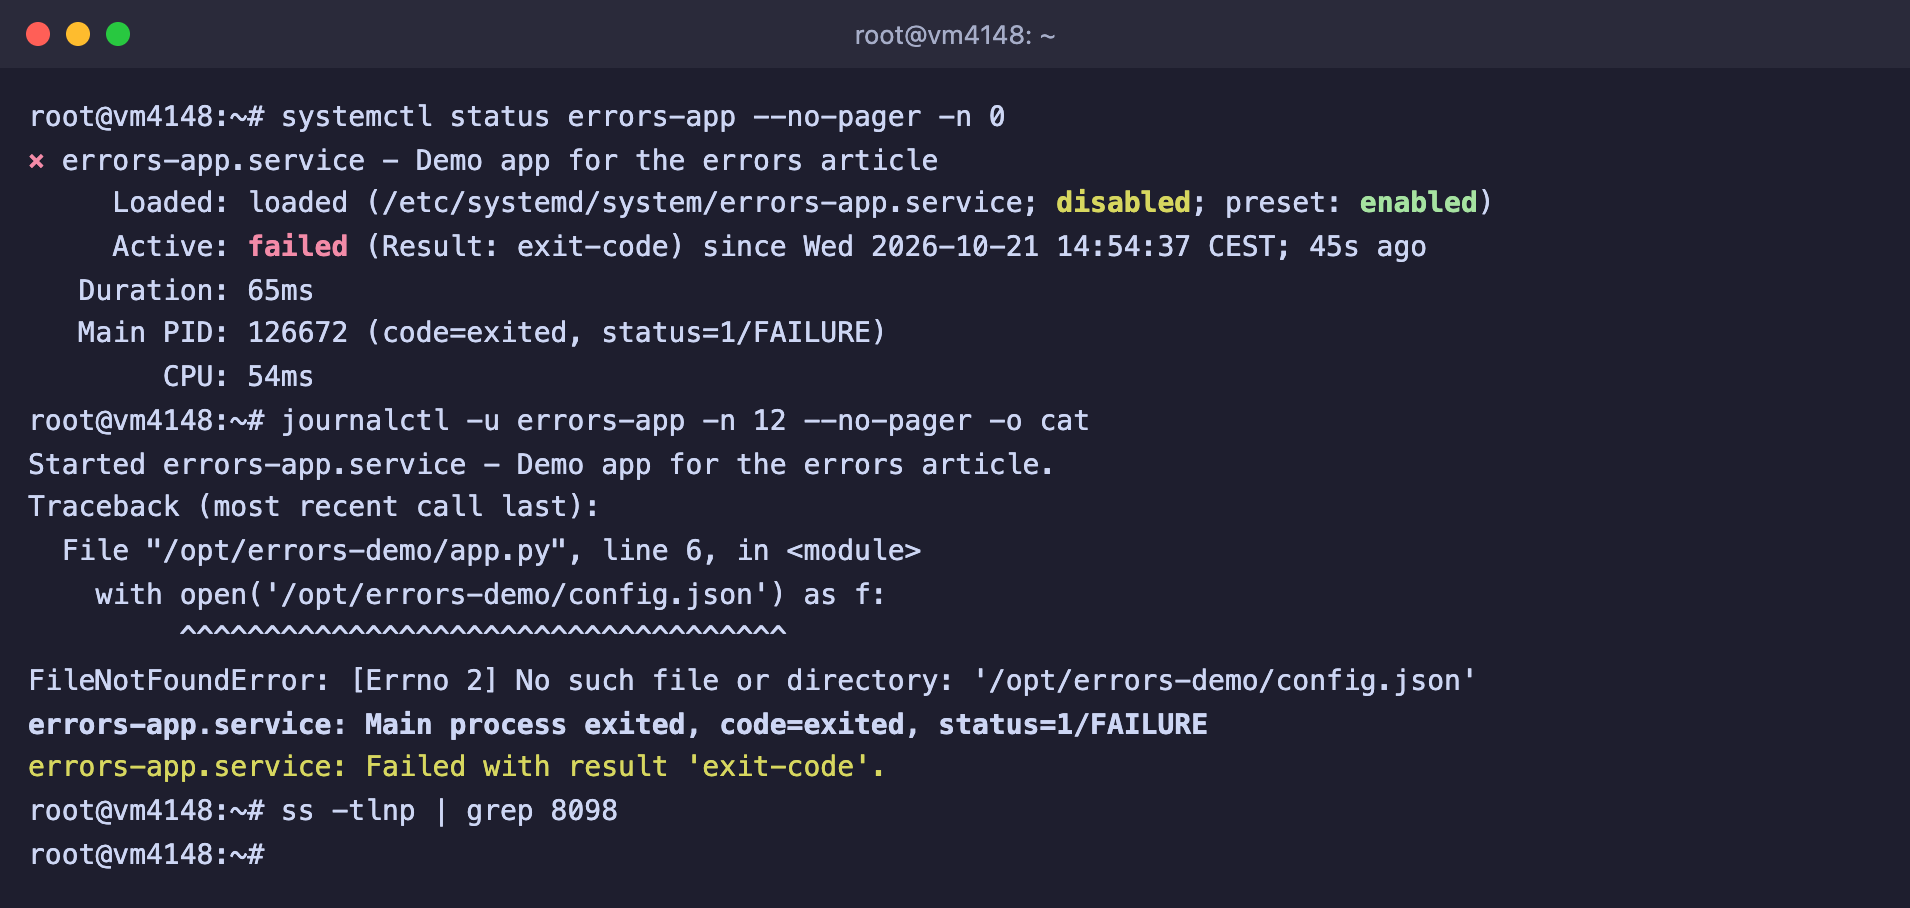
The service is in the failed state, the log shows the cause, and nobody listens on port 8098
In the screenshot the errors-app service crashed right after starting. The log shows the cause, FileNotFoundError, meaning the application was missing its settings file. Knowing the error number and the log line, you can move on to the specific cause.
Error 502 Bad Gateway
A 502 page means that Nginx accepted the request but could not get a response from the backend. It looks like a short white page with the Nginx version number at the bottom.
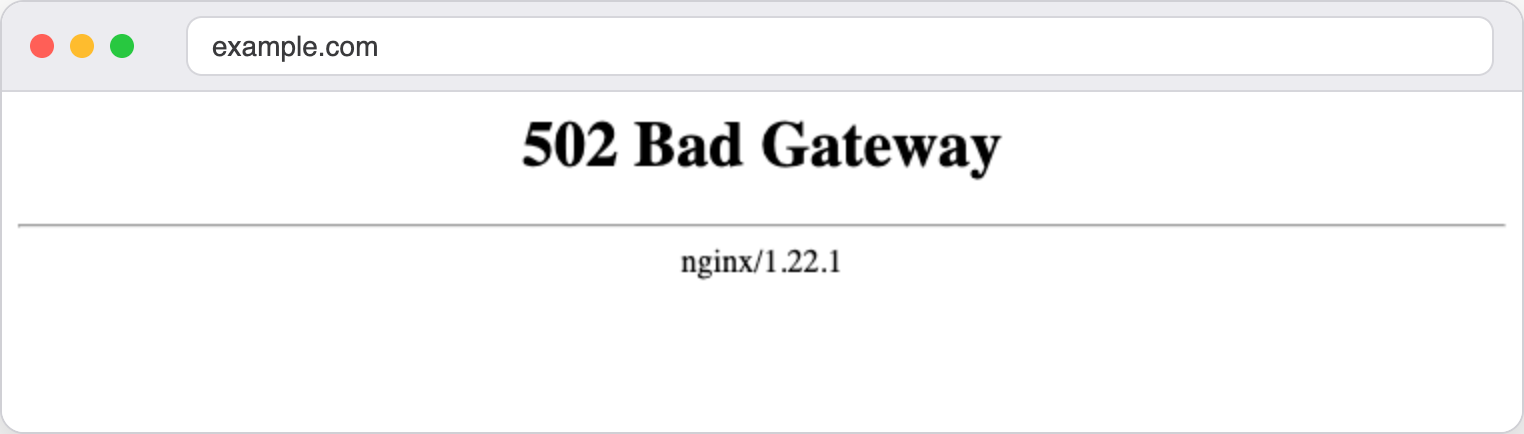
This is how the 502 error looks in a browser
We reproduced the three most common causes, and each one has its own line in the log.
The application is not running
This is the simplest and most common cause. In the Nginx settings the site passes requests to the application.
location / {
    proxy_pass http://127.0.0.1:8098;
}
If the application has stopped, crashed, or never started after a server reboot, there is nobody on its port. The log then contains the familiar line.
2026/10/21 14:53:33 [error] 124894#124894: *3 connect() failed (111: Connection refused) while connecting to upstream, client: 127.0.0.1, server: example.com, request: "GET / HTTP/1.1", upstream: "http://127.0.0.1:8098/", host: "example.com"The code 111: Connection refused literally means that the connection was refused because the port is closed. In our example the cause was shown by the service log that you saw in the screenshot above. The application did not start because we renamed its settings file. Put the file back and start the service.
# Put the settings file back
mv /opt/errors-demo/config.json.old /opt/errors-demo/config.json

# Start the service and check the site response
systemctl start errors-app
curl -I http://127.0.0.1:8091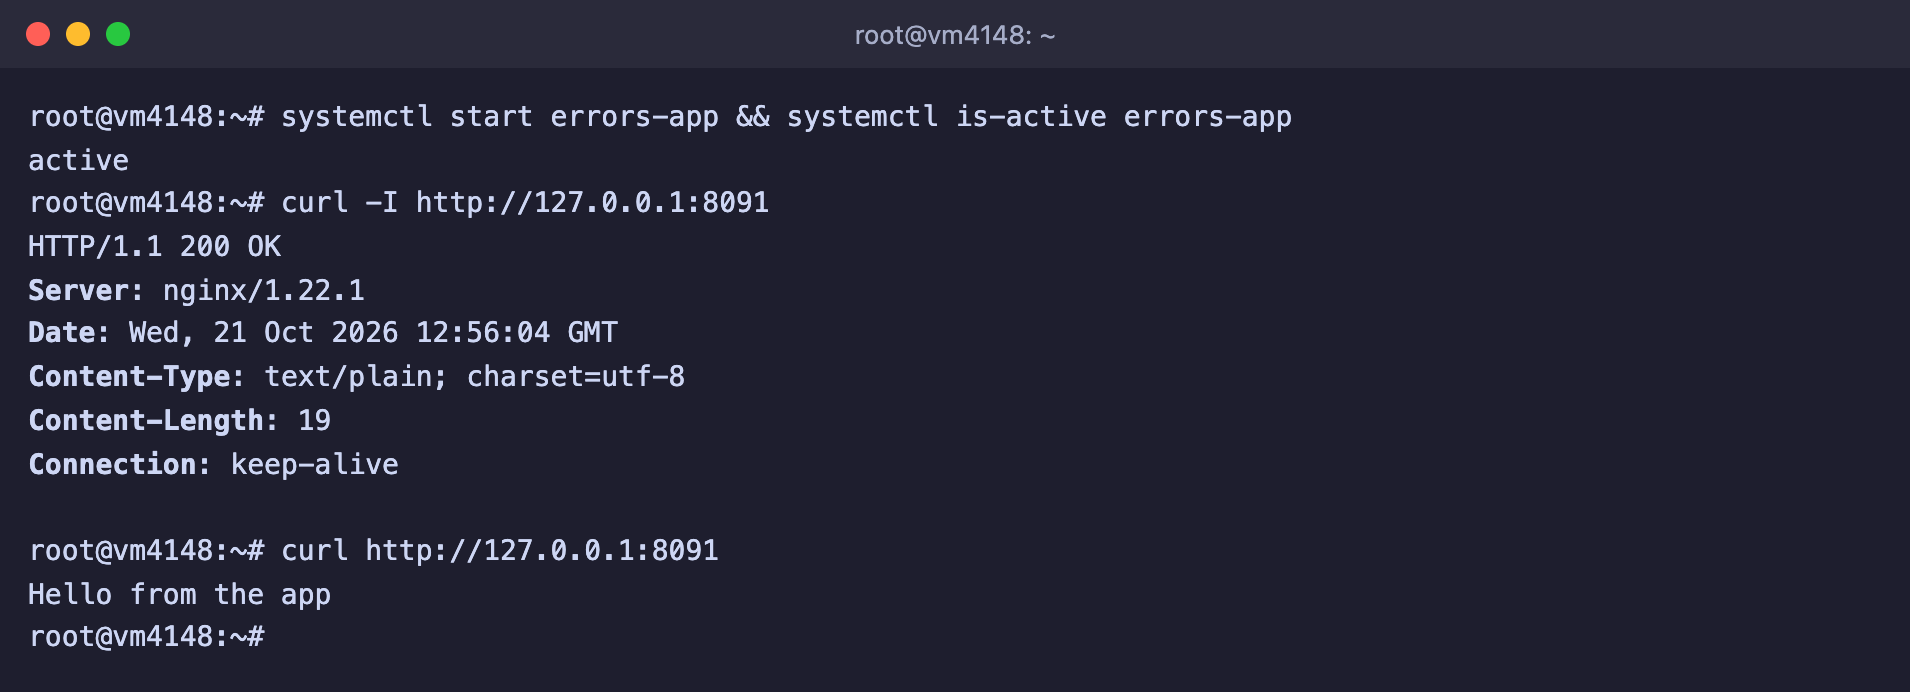
The service is running, and the site answers with code 200 again
To keep this error from coming back after every crash, let systemd bring the application back up by itself. To do that, add two lines to the [Service] section of the service file.
[Service]
# Restart the application if it crashed
Restart=on-failure
# Wait three seconds before restarting
RestartSec=3
Then reload the settings and enable autostart at server boot.
# Apply the changes in the service file
systemctl daemon-reload

# Enable start together with the server
systemctl enable errors-app
The check turned out to be very clear. We forcibly killed the process with the command systemctl kill -s KILL errors-app. Right after that the site answered with code 502, and three seconds later systemd started the application again and the site opened once more. Note that before autostart was enabled, the Loaded line in the screenshot said disabled. It means the service does not start by itself after a server reboot.
PHP-FPM, socket not found
For PHP sites, Nginx passes requests not to a port but to a socket, that is, a special file through which it talks to PHP-FPM. The path to it is set in the fastcgi_pass directive.
location ~ \.php$ {
    include snippets/fastcgi-php.conf;
    fastcgi_pass unix:/run/php/php8.1-fpm.sock;
}
If there is no such file, Nginx answers 502, and the log says so in plain words.
2026/10/21 14:53:33 [crit] 124894#124894: *5 connect() to unix:/run/php/php8.1-fpm.sock failed (2: No such file or directory) while connecting to upstream, client: 127.0.0.1, server: example.com, request: "GET / HTTP/1.1", upstream: "fastcgi://unix:/run/php/php8.1-fpm.sock:", host: "example.com"The code 2: No such file or directory means the socket file does not exist. Most often there are two causes. Either the settings contain a name from a different PHP version, for example from instructions for PHP 8.1 while you have 8.2 installed, or the PHP-FPM service is stopped and its socket disappeared with it. Look at which sockets exist on the server.
# List of PHP-FPM sockets
ls /run/php/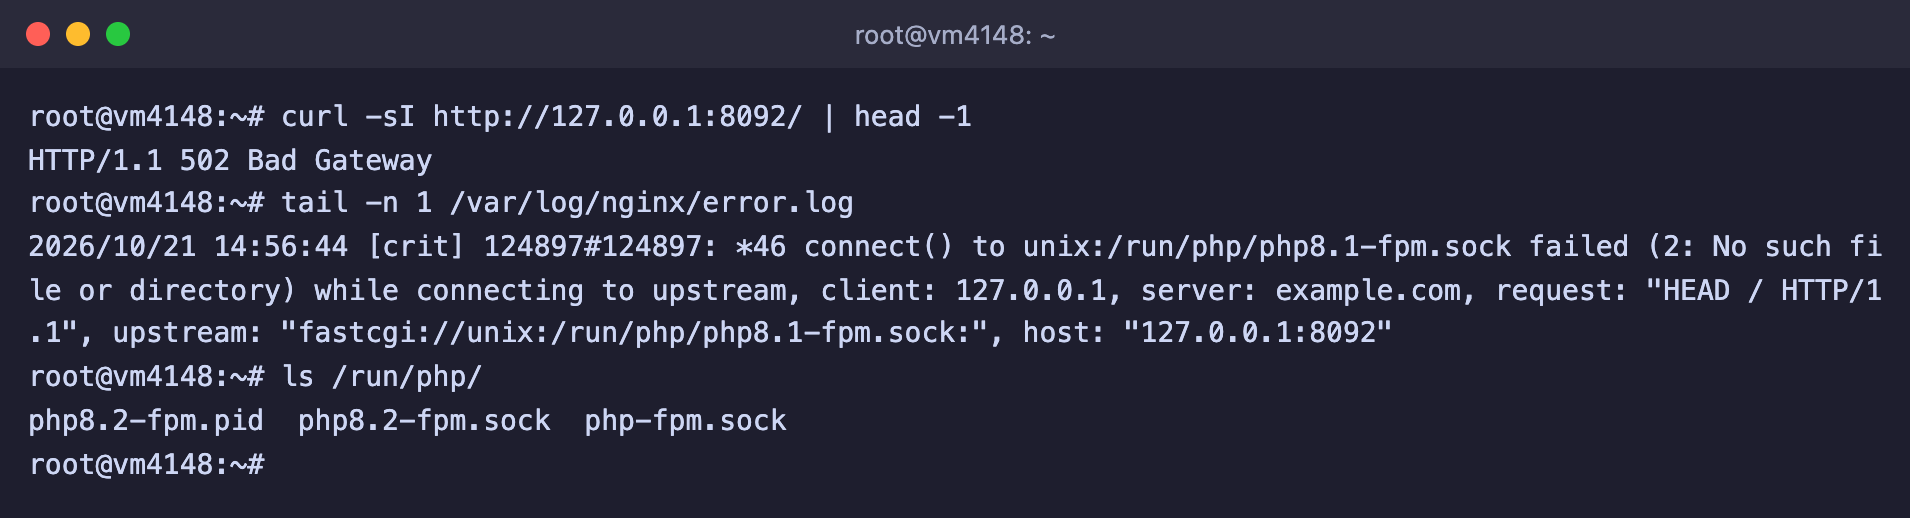
The settings point to php8.1-fpm.sock, but the server only has php8.2-fpm.sock
In our example the folder contained php8.2-fpm.sock and php-fpm.sock. Fix the name in fastcgi_pass, check the settings and apply them.
# Change the version in the socket name
sed -i 's/php8.1-fpm.sock/php8.2-fpm.sock/' /etc/nginx/sites-available/example.com

# Check the settings and apply them
nginx -t && systemctl reload nginx
The php-fpm.sock file
In Debian, next to the socket of a specific version there is also php-fpm.sock. It is a link to the socket of the installed PHP version, and on our server it pointed to php8.2-fpm.sock. If you put exactly this one in fastcgi_pass, you will not have to change the name in the settings when you change the PHP version. We checked that a site with such a path answers normally.
If the name is correct but the socket is still missing, then PHP-FPM itself has stopped. We stopped it with the command systemctl stop php8.2-fpm and got the same 502 error with the line connect() to unix:/run/php/php8.2-fpm.sock failed (2: No such file or directory). The command systemctl status php8.2-fpm showed inactive (dead), and after the service was started the site worked again.
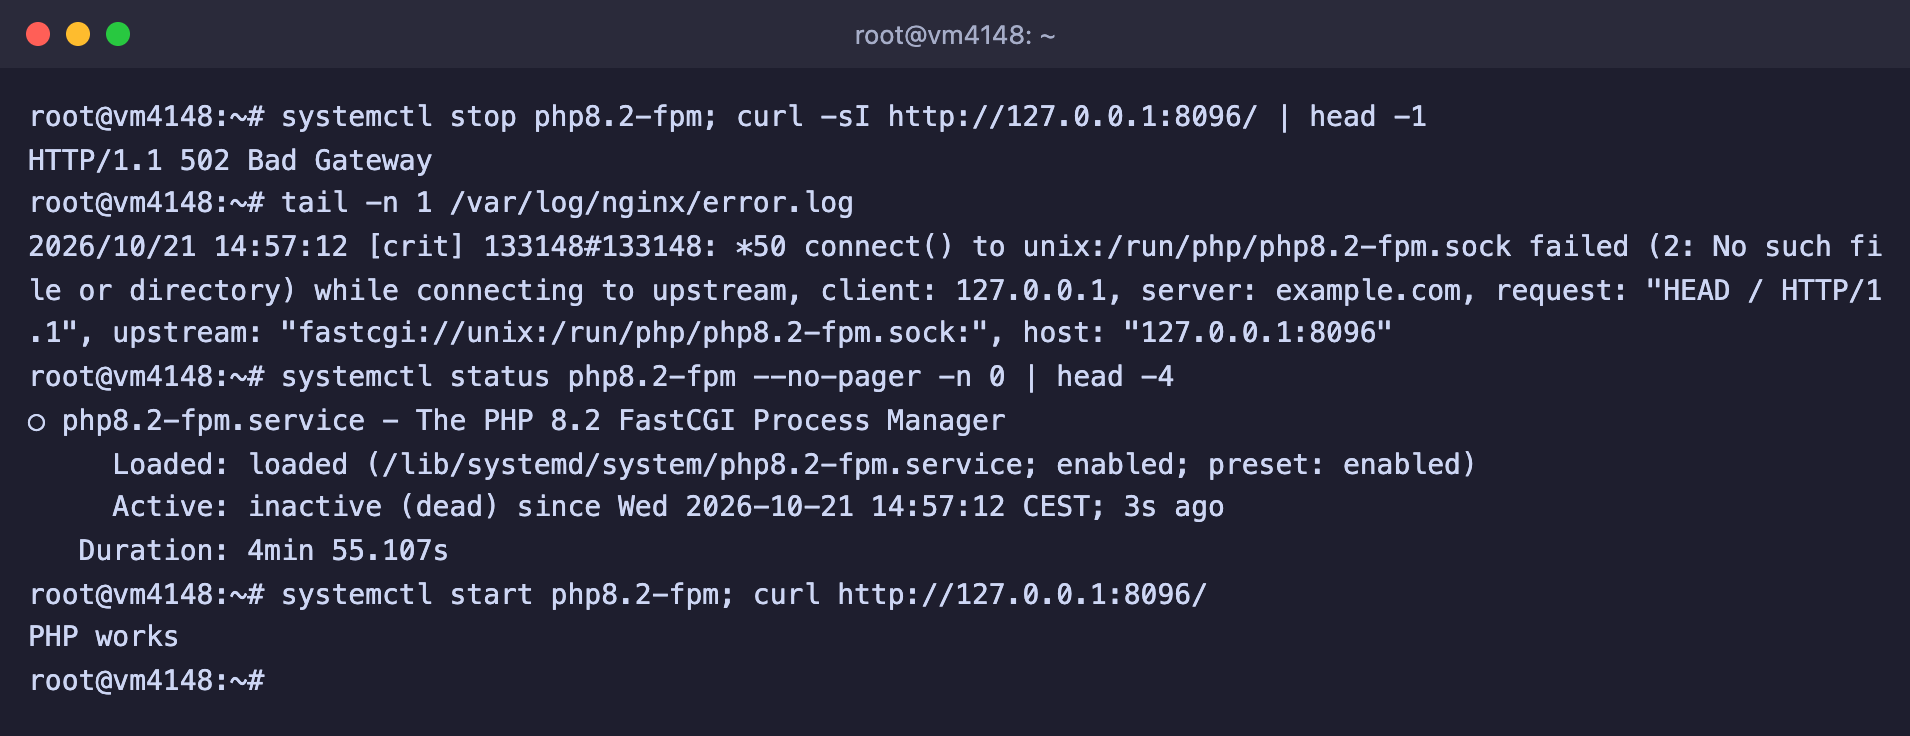
PHP-FPM is stopped, there is no socket, and after the service starts the site opens again
If the service does not start, the cause will be shown by journalctl -u php8.2-fpm -n 50 --no-pager. And after editing the PHP-FPM settings, check them with the command php-fpm8.2 -t, as we will show later.
PHP-FPM, no access to the socket
It also happens that the socket is in place but Nginx cannot use it. The log then shows a different code.
2026/10/21 14:57:38 [crit] 133790#133790: *56 connect() to unix:/run/php/errors-fpm.sock failed (13: Permission denied) while connecting to upstream, client: 127.0.0.1, server: example.com, request: "HEAD / HTTP/1.1", upstream: "fastcgi://unix:/run/php/errors-fpm.sock:", host: "127.0.0.1:8099"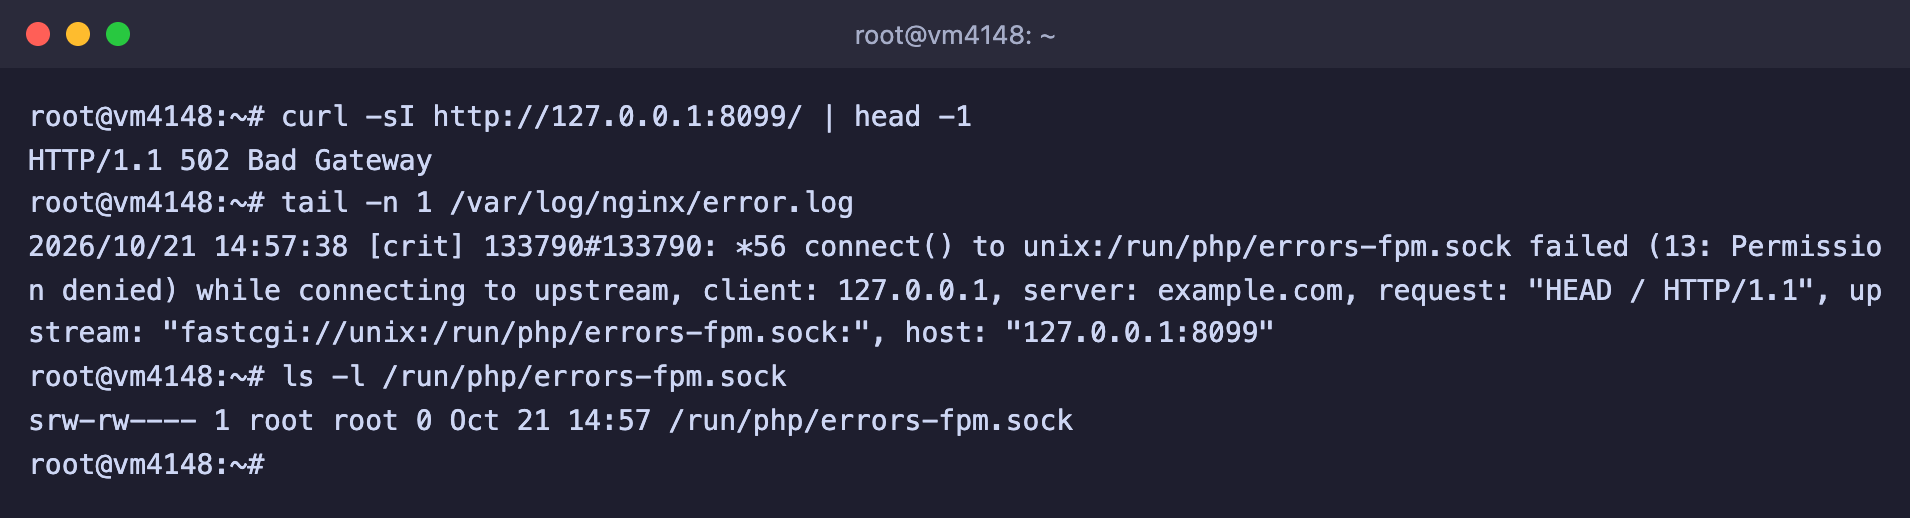
The socket is in place, but it belongs to root and Nginx cannot connect to it
The code 13: Permission denied means Nginx has no rights to this file. Nginx runs as the www-data user, and access to the socket is determined by the listen.owner, listen.group and listen.mode parameters in the PHP-FPM pool settings. According to the PHP documentation, if you do not specify an owner, the socket gets the user that the service runs as and the permissions 0660. In our example we created a separate pool errors in the file /etc/php/8.2/fpm/pool.d/errors.conf and did not specify an owner.
[errors]
user = nobody
group = nogroup
listen = /run/php/errors-fpm.sock
pm = ondemand
pm.max_children = 2
pm.process_idle_timeout = 10s
The service runs as root, so the socket got the owner root and the permissions srw-rw----, and www-data is not in that group. Add two lines with the owner to the pool.
# Go to the folder with the pool settings
cd /etc/php/8.2/fpm/pool.d

# Allow the Nginx user to work with the socket
printf 'listen.owner = www-data\nlisten.group = www-data\n' >> errors.conf

# Check the settings and restart PHP-FPM
php-fpm8.2 -t && systemctl restart php8.2-fpm

# Look at the socket owner and check the site
ls -l /run/php/errors-fpm.sock
curl http://127.0.0.1:8099/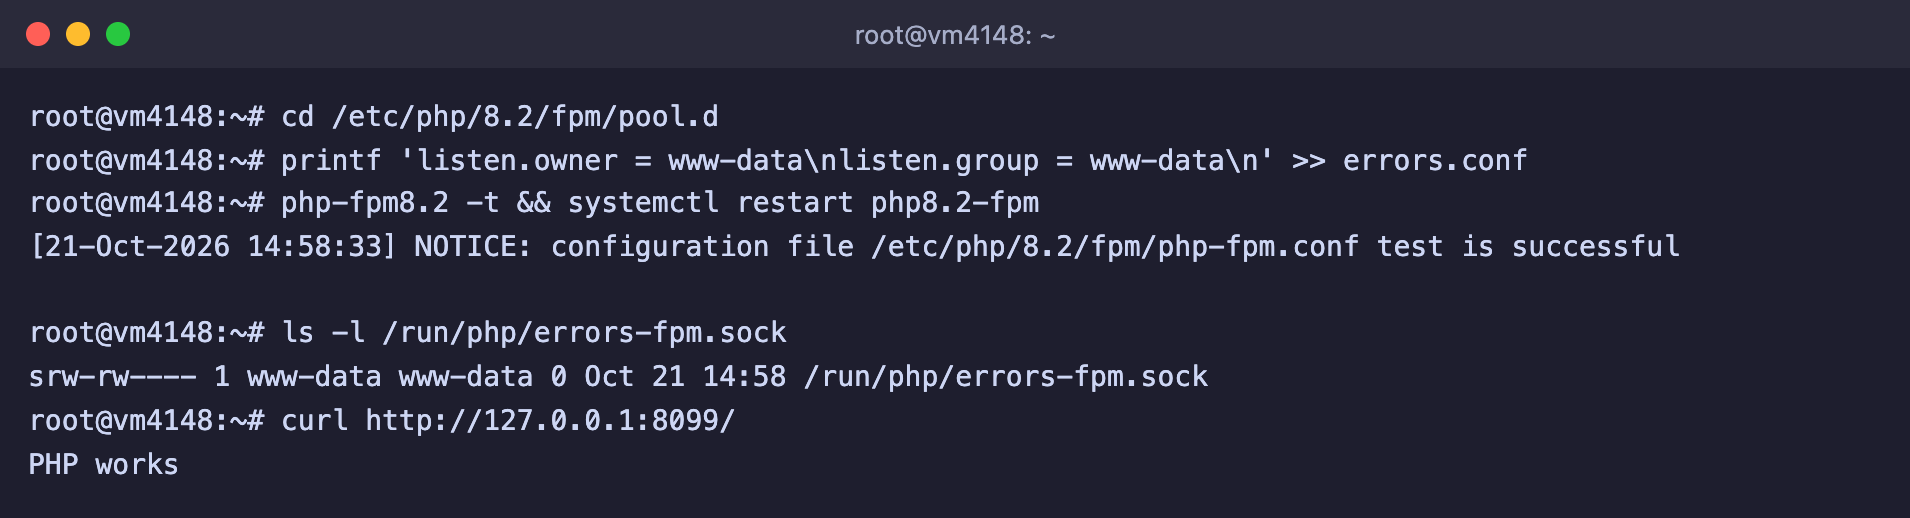
The socket belongs to www-data, and the site answers
You need restart, not reload
When we ran systemctl reload php8.2-fpm after the edit, the socket owner stayed the same, root, and the 502 error did not go away. The socket changed its owner only after systemctl restart php8.2-fpm.
Always check the settings before reloading
Get into the habit of running nginx -t before every reload command. If there is an error in the settings, the check will show it, and the running Nginx will keep answering with the old configuration. PHP-FPM has the same kind of check, the command php-fpm8.2 -t.
Error 504 Gateway Time-out
A 504 page says that the backend is alive and accepted the request, but takes too long to prepare the response. Nginx waits for it for a limited time and, if it does not arrive, cuts the wait itself. The wait time is set by the proxy_read_timeout directive, which is 60 seconds by default, and for PHP-FPM the same role is played by fastcgi_read_timeout. An important detail from the Nginx documentation is that this time is counted between two successive reads, not for the whole response. If the backend sends the next portion of data more often than once every 60 seconds, the connection will not be cut.
To see this with your own eyes, we added the address /slow to the test application, which answers only after 75 seconds, like a heavy report or a long database query. The page loaded for exactly a minute, and then the error appeared.
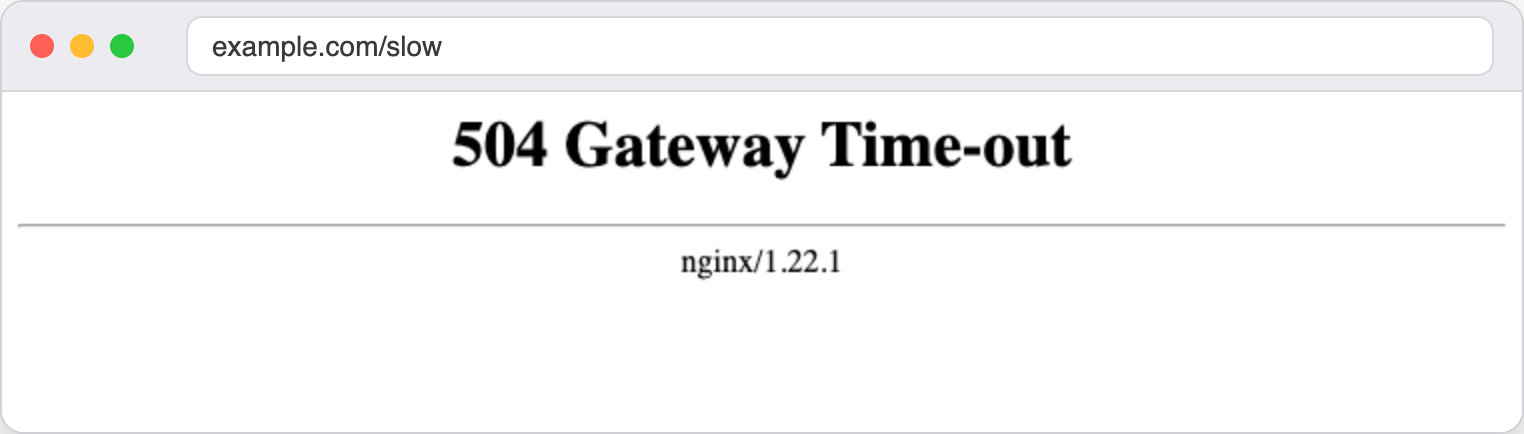
The 504 error appears after a minute of waiting
The curl command with the -w option lets you measure the time and see the code at a glance.
# Show the response code and the wait time
curl -s -o /dev/null -w '%{http_code} in %{time_total} s\n' http://127.0.0.1:8093/slow
The following entry appeared in the log at the same time.
2026/10/21 15:04:14 [error] 144934#144934: *81 upstream timed out (110: Connection timed out) while reading response header from upstream, client: 127.0.0.1, server: example.com, request: "GET /slow HTTP/1.1", upstream: "http://127.0.0.1:8098/slow", host: "127.0.0.1:8093"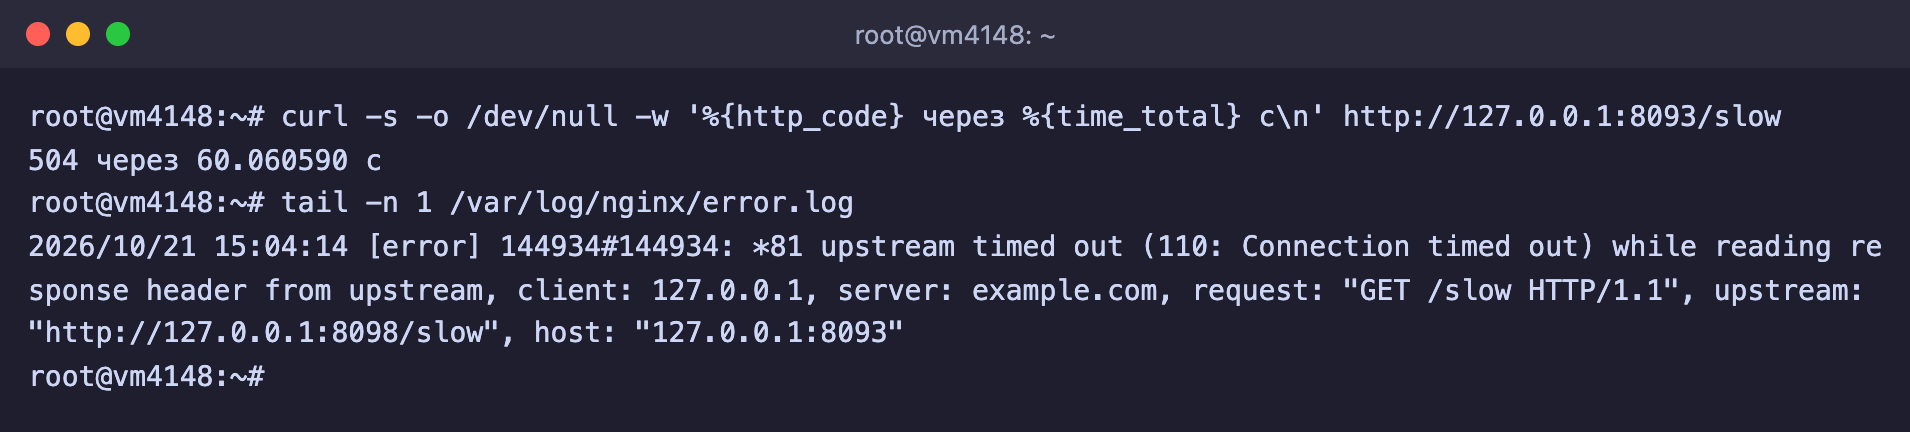
Code 504 after 60.06 seconds and the upstream timed out line in the log
The words while reading response header mean that Nginx connected successfully, sent the request and waited for the start of the response. The measurement showed 60.06 seconds, so Nginx cut the wait right at the default value.
It is best to fix 504 at its cause. Find out what exactly runs for so long, for example a heavy database query, a call to someone else's service or a big report, and speed it up. If the task is long by nature, for example an export or an import, increase the wait time for the address you need. Add the proxy_read_timeout directive to the location block.
location / {
    proxy_pass http://127.0.0.1:8098;
    # Wait for the application response for up to two minutes
    proxy_read_timeout 120s;
}
Check the settings and apply them, and then repeat the request.
# Check the settings and apply them
nginx -t && systemctl reload nginx

# Repeat the request
curl -s -o /dev/null -w '%{http_code} in %{time_total} s\n' http://127.0.0.1:8093/slow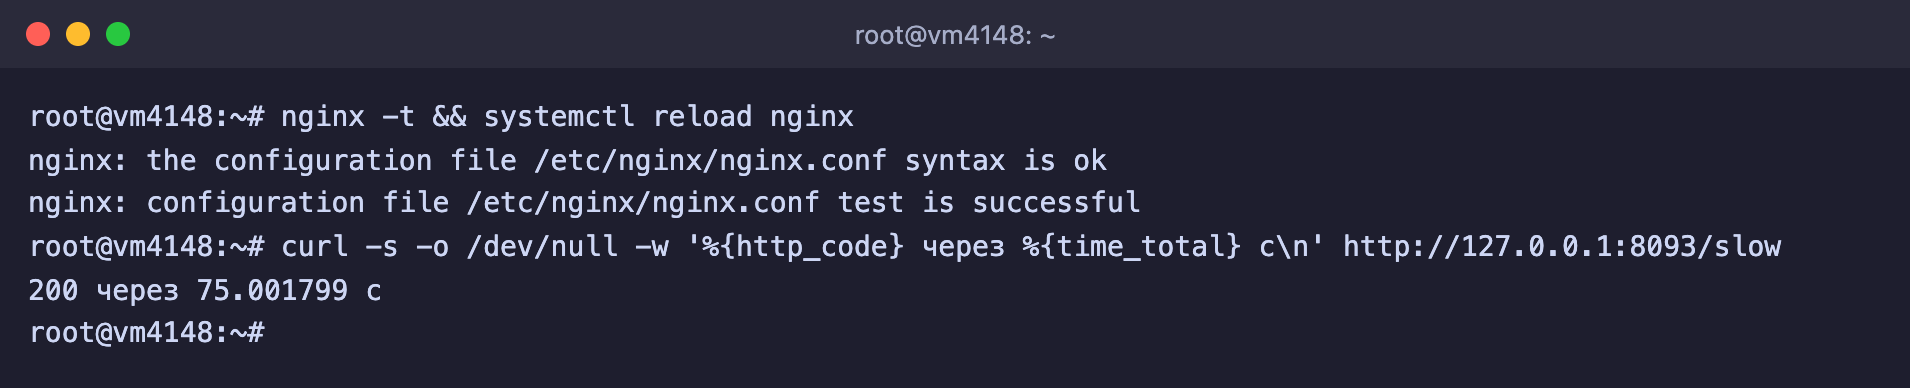
The same request now returns 200 after 75 seconds
For PHP-FPM sites you do the same, only the directive is called fastcgi_read_timeout and sits in the location ~ \.php$ block next to fastcgi_pass. We checked this on a script that answers after 70 seconds. With the default settings it gave 504 at exactly 60 seconds, and with the line fastcgi_read_timeout 120s; it answered with code 200 after 70 seconds. The log line looked like this.
2026/10/21 15:07:46 [error] 153814#153814: *89 upstream timed out (110: Connection timed out) while reading response header from upstream, client: 127.0.0.1, server: example.com, request: "GET /slow.php HTTP/1.1", upstream: "fastcgi://unix:/run/php/php8.2-fpm.sock", host: "127.0.0.1:8096"The Nginx timeout does not cancel the PHP limit
PHP itself has its own limit on script run time, the max_execution_time parameter. In the file /etc/php/8.2/fpm/php.ini on our server it equals 30 seconds. We ran a script that kept the processor busy continuously, and PHP stopped it at exactly 30 seconds. The response was not a 504 but a 500 error, and the log got the line PHP Fatal error: Maximum execution time of 30 seconds exceeded in /var/www/errors-demo-php/busy.php on line 3. A script that simply waited with a sleep(70) call did not hit this limit, because according to the PHP documentation the wait time of system calls is not counted on Linux. If your script runs into the PHP limit, raise max_execution_time, not only the Nginx timeout.
Error 403 Forbidden
A 403 page means that Nginx understood the request but refused to answer it. In practice there are two causes. Either there is nothing to show in the folder, or Nginx has no rights to read the file. In the log these cases are easy to tell apart, so always start with it.
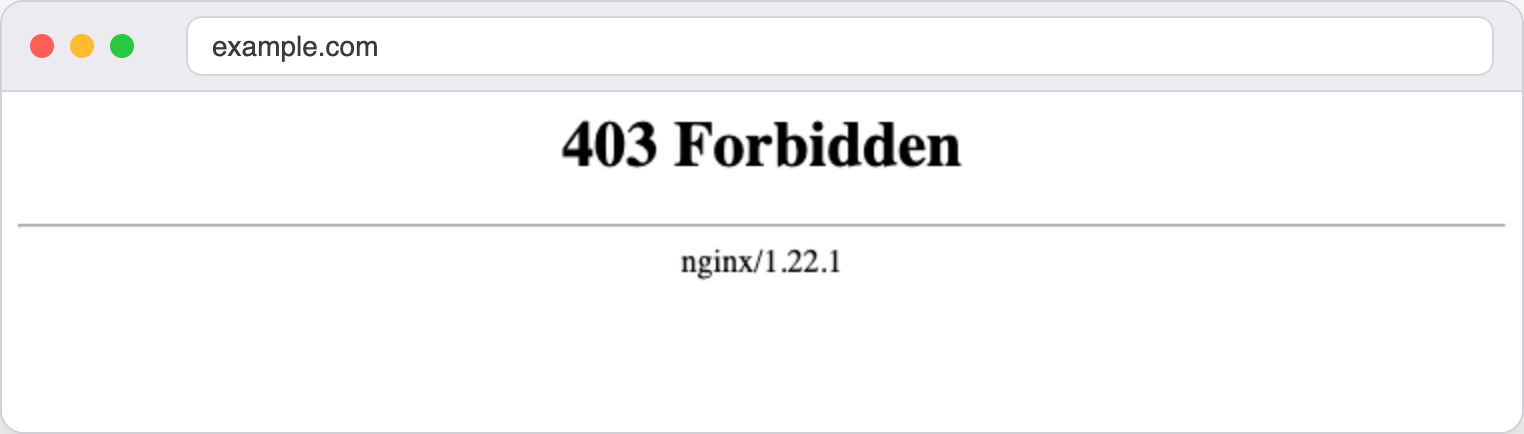
This is how the 403 error looks in a browser
No index file
When a visitor opens a folder address, for example https://example.com/, Nginx looks for the main page in it. The file name is set by the index directive, which is index.html by default. If there is no such file, Nginx could show a list of the folder files, but this is turned off by default (autoindex off), and that is why it answers 403.
2026/10/21 14:53:33 [error] 124894#124894: *7 directory index of "/var/www/errors-demo-403a/" is forbidden, client: 127.0.0.1, server: example.com, request: "GET / HTTP/1.1", host: "example.com"The phrase directory index of … is forbidden means exactly that the folder has no index file and the file list is forbidden. Look at what is in the site folder.
# Look at the contents of the site folder
ls -la /var/www/errors-demo-403a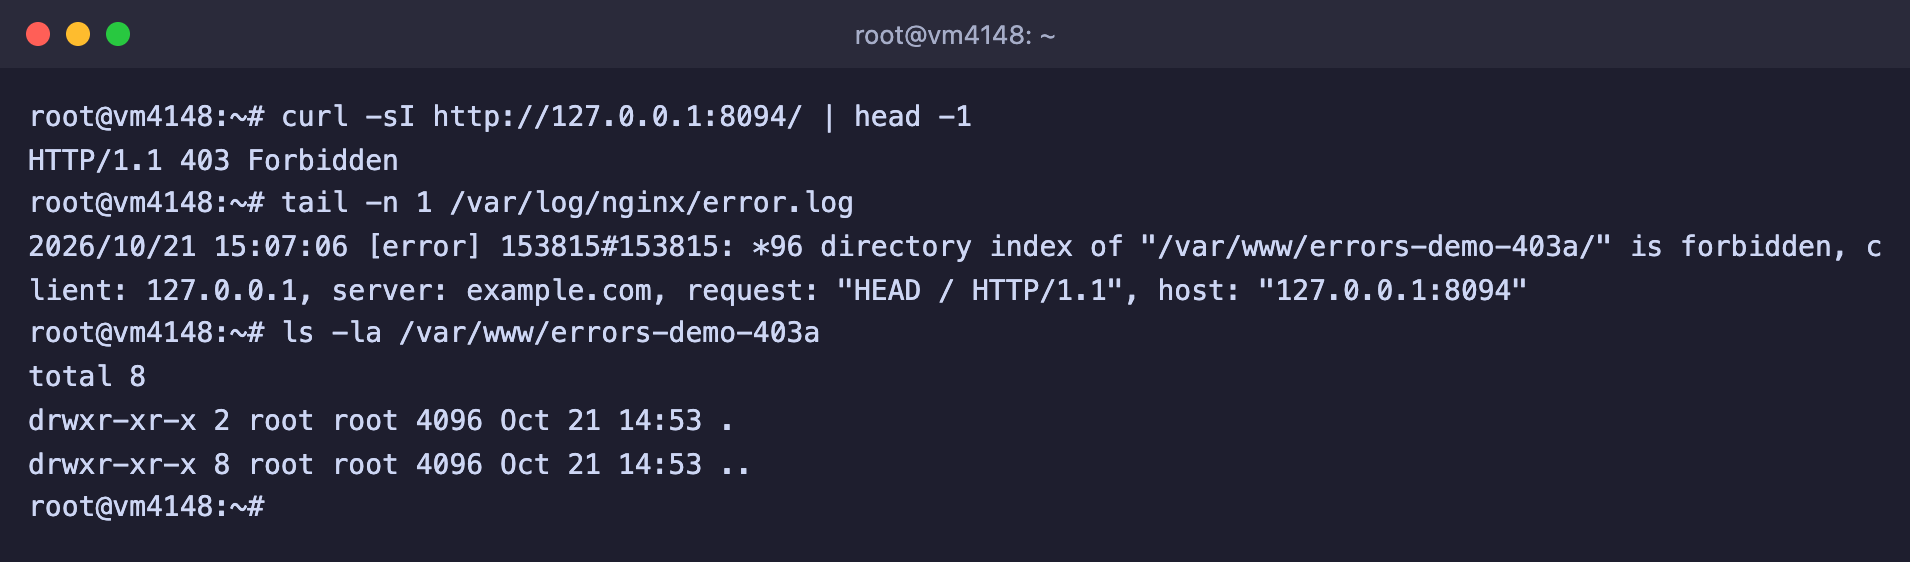
There is no main page in the site folder, so Nginx answers 403
The folder turned out to be empty. Most often this happens when the site was uploaded to the wrong folder or you forgot to upload the main page file itself. Check that the root directive points to the folder where the site really is, and that it contains a file with the name from the index directive. If for a PHP site it is index.php, make sure it is listed in index index.html index.php;. After you upload the file, the response changes immediately, and you do not need to reload Nginx.
# Create the main page
echo '<h1>Site works</h1>' > /var/www/errors-demo-403a/index.html

# Check the response
curl -sI http://127.0.0.1:8094/ | head -1
After that the server answered HTTP/1.1 200 OK.
If you really need a file list, for example for a folder with archives, turn it on with the autoindex on; directive in the location block you need. We checked that in this case Nginx serves an Index of / page with the list of the folder files.
Everyone can see the file list
With autoindex on, any visitor will see the names of all files in the folder and will be able to download each of them. Turn it on only for folders you are ready to show in full.
No permission for the file
In the second case the file is in place, but Nginx cannot read it. The log reports this as follows.
2026/10/21 14:53:33 [error] 124894#124894: *8 open() "/var/www/errors-demo-403b/index.html" failed (13: Permission denied), client: 127.0.0.1, server: example.com, request: "GET / HTTP/1.1", host: "example.com"The code 13: Permission denied means access was denied at the Linux level. To understand whose rights matter, find out which user Nginx runs as, and then look at the permissions of every element of the path with the namei command.
# Which user Nginx runs as
grep ^user /etc/nginx/nginx.conf

# Permissions of every folder and file on the path
namei -l /var/www/errors-demo-403b/index.html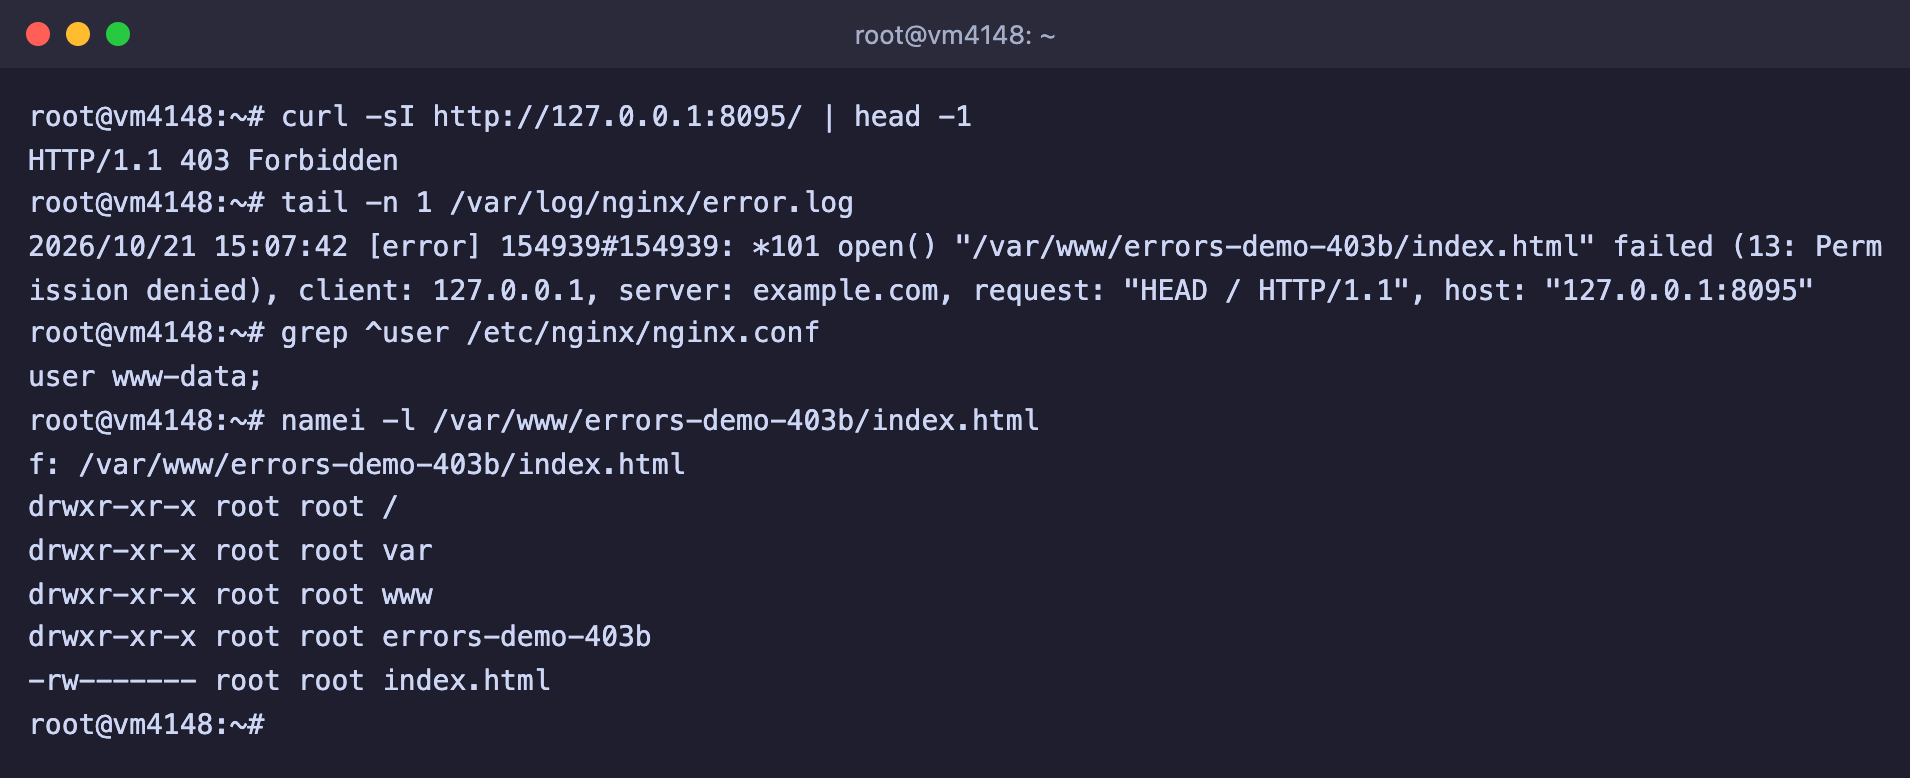
Nginx runs as www-data, and the file is closed to everyone except root
Nginx runs as www-data, while the file has the permissions -rw------- and belongs to root, which means only the owner can read it. For www-data this is an outsider, and it has no access. We got this picture by creating the file as root with the permissions 600. A simple rule works for a website. Folders get 755, files get 644, and the web server user becomes the owner. How permissions work and what these numbers mean is explained in the article about Linux permissions.
# Hand the site over to the web server user
chown -R www-data:www-data /var/www/errors-demo-403b

# 755 for folders, 644 for files
find /var/www/errors-demo-403b -type d -exec chmod 755 {} +
find /var/www/errors-demo-403b -type f -exec chmod 644 {} +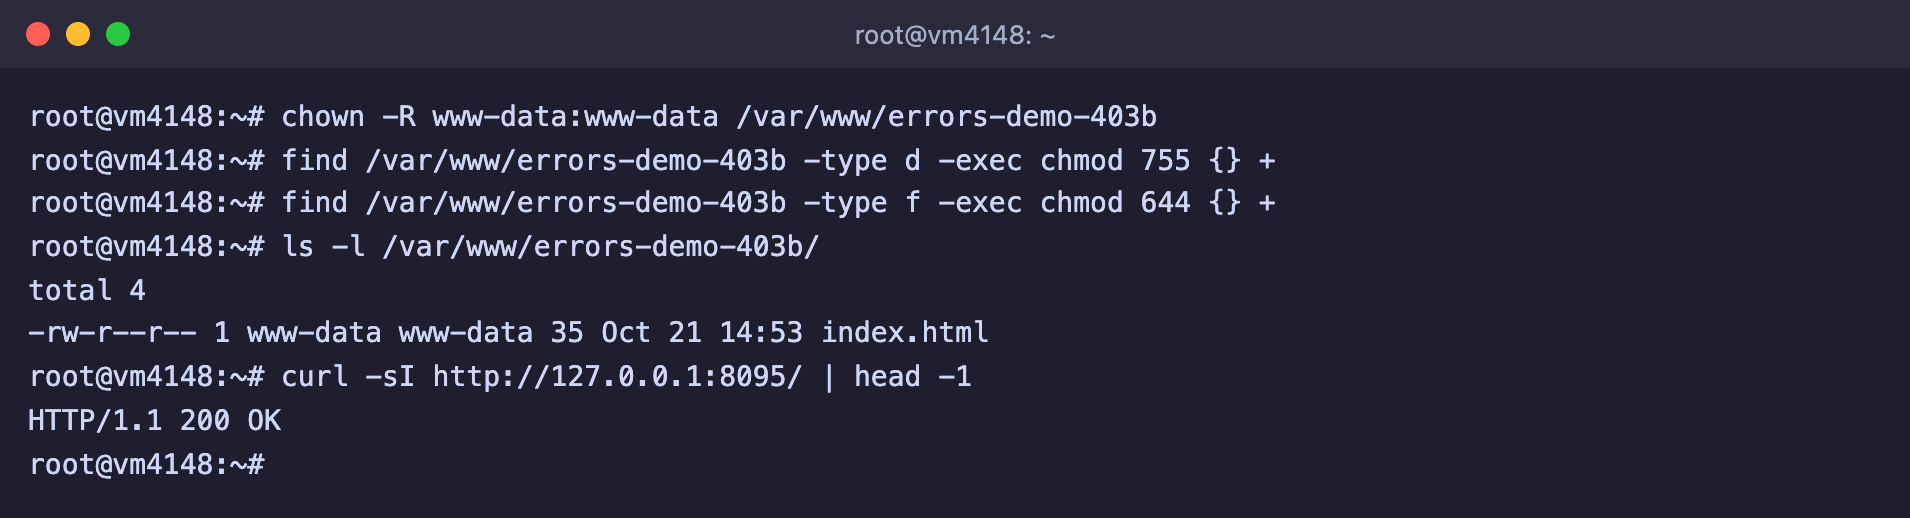
The file is readable, and the site answers with code 200
To read a file, Nginx only needs the r permission for "others". We checked that with the owner root and the permissions 644 the site also opens, and the change of owner is needed so that the site can save uploaded files on its own.
Do not fix 403 with 777 permissions
The 777 permissions allow all users of the server to read and change the file, and the error does go away. But the protection of the site goes away with it, so it is best not to follow such advice from the internet. Make www-data the owner and set 755 and 644.
No permission for a folder on the path to the file
Sometimes the file itself is open to everyone, yet the error stays. To reach the file, Nginx must pass through every folder on the path, and for that www-data needs the x permission on each of them. It is enough for a single folder to be closed. The log in this case looks a little different, without the word open().
2026/10/21 15:08:10 [error] 156517#156517: *109 "/var/www/errors-demo-403c/public/index.html" is forbidden (13: Permission denied), client: 127.0.0.1, server: example.com, request: "GET / HTTP/1.1", host: "127.0.0.1:8095"In our example the index.html file has the permissions 644, but the folder above it is closed. The same namei command will help you find it.
# Look for the closed folder on the path to the file
namei -l /var/www/errors-demo-403c/public/index.html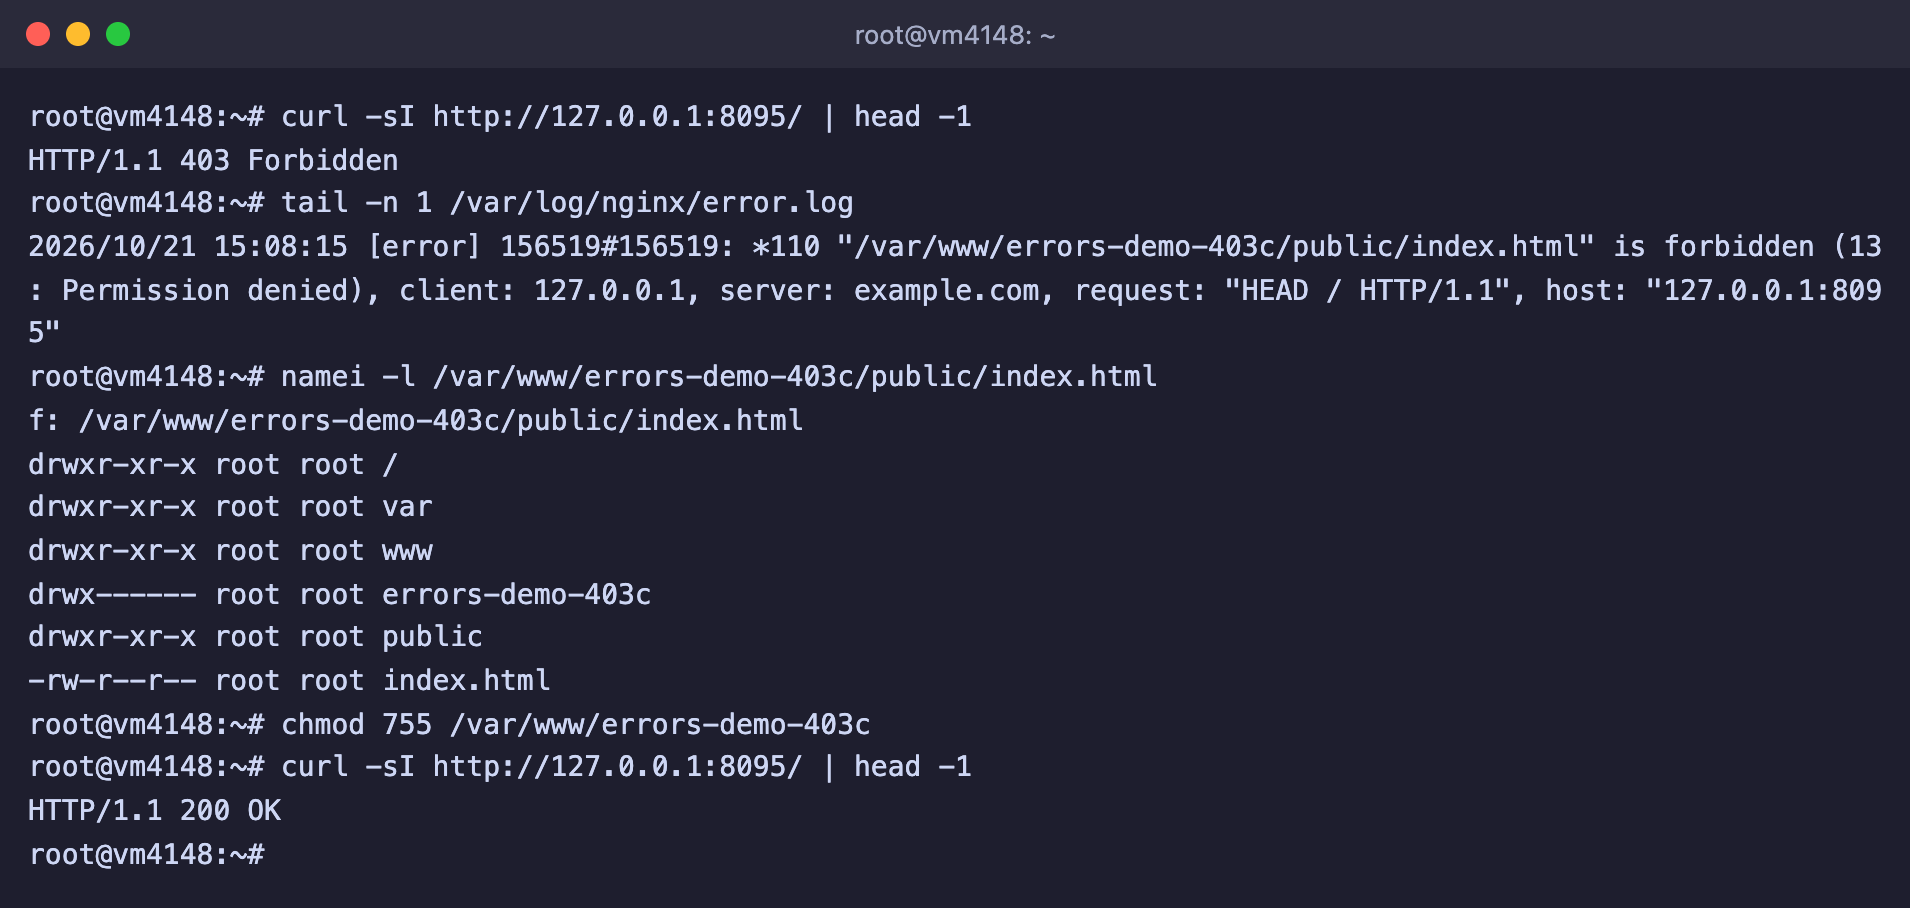
The errors-demo-403c folder is closed to everyone except root, and after chmod 755 the site opens
In the output the errors-demo-403c folder has the permissions drwx------, and the other folders are open. Open it for reading and entering.
# Allow all users to enter the folder
chmod 755 /var/www/errors-demo-403c
This picture is typical for sites that are stored in a closed folder, for example a home folder. On our server the /root folder has the permissions 700, so you should not put a site in it. For sites, use /var/www.
Error 500 Internal Server Error
Code 500 is called the most vague one, because it simply means "something went wrong while handling the request". That is why it is especially important to look into the log here. We reproduced two causes that come up more often than others. The first relates to PHP, the second to Nginx itself.
Fatal error in PHP
If a PHP script crashed, PHP-FPM answers with code 500. By default PHP does not show the error text to the visitor, and in our case the display_errors parameter in /etc/php/8.2/fpm/php.ini was off and log_errors was on. The response body turned out empty, so the message was drawn by the browser itself, not by Nginx.
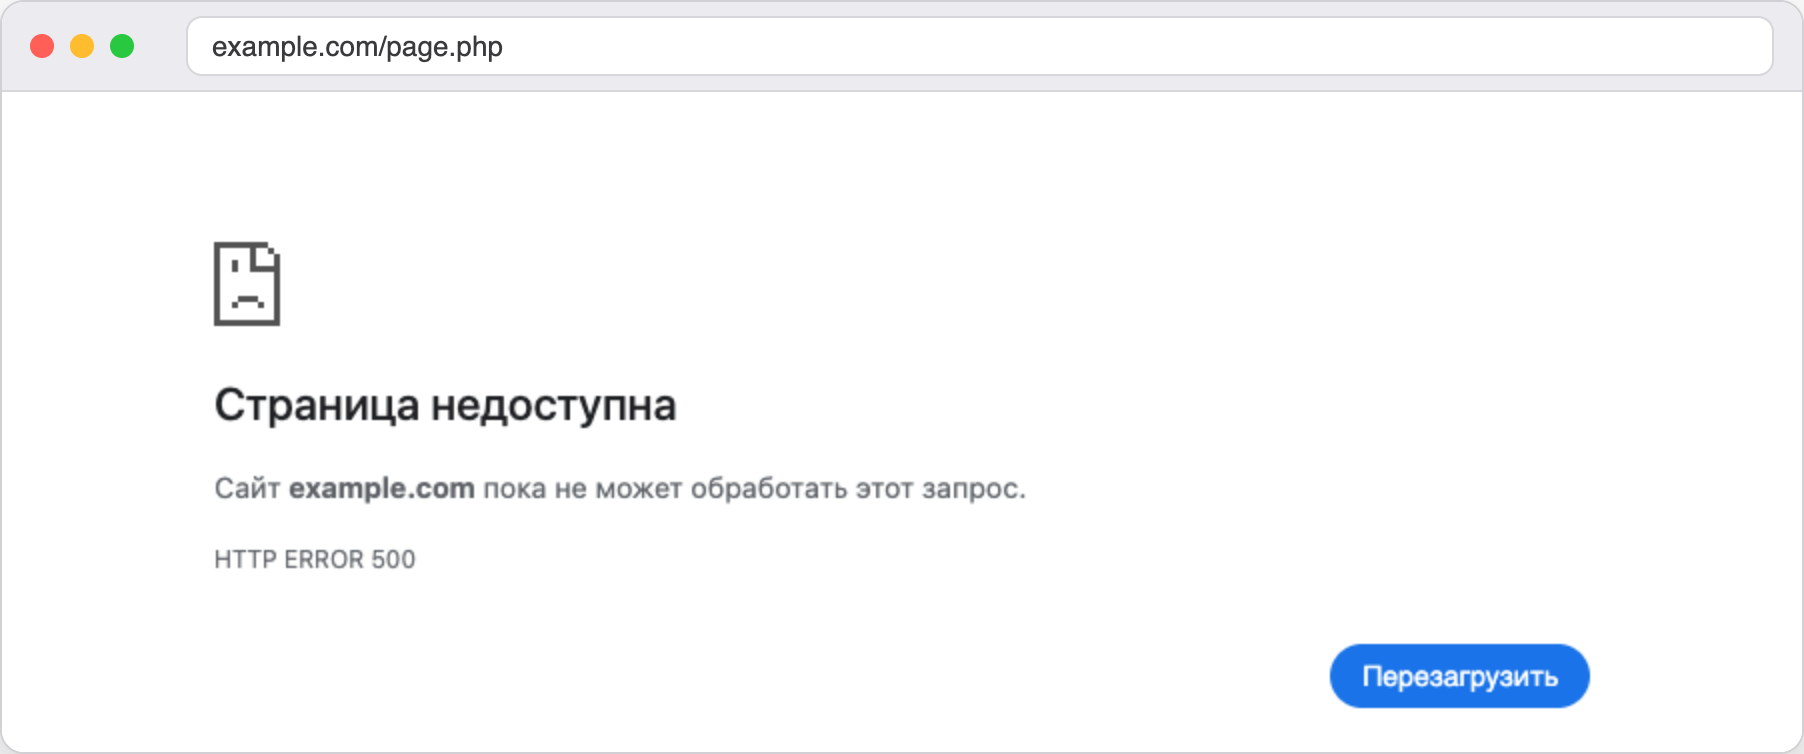
With an empty response the browser shows its own page with the HTTP ERROR 500 code
But everything PHP wanted to say ends up in the Nginx log.
2026/10/21 15:09:26 [error] 156517#156517: *123 FastCGI sent in stderr: "PHP message: PHP Fatal error:  Uncaught Error: Call to undefined function mb_strlen() in /var/www/errors-demo-php/page.php:3
Stack trace:
#0 {main}
  thrown in /var/www/errors-demo-php/page.php on line 3" while reading response header from upstream, client: 127.0.0.1, server: example.com, request: "GET /page.php HTTP/1.1", upstream: "fastcgi://unix:/run/php/php8.2-fpm.sock:", host: "127.0.0.1:8096"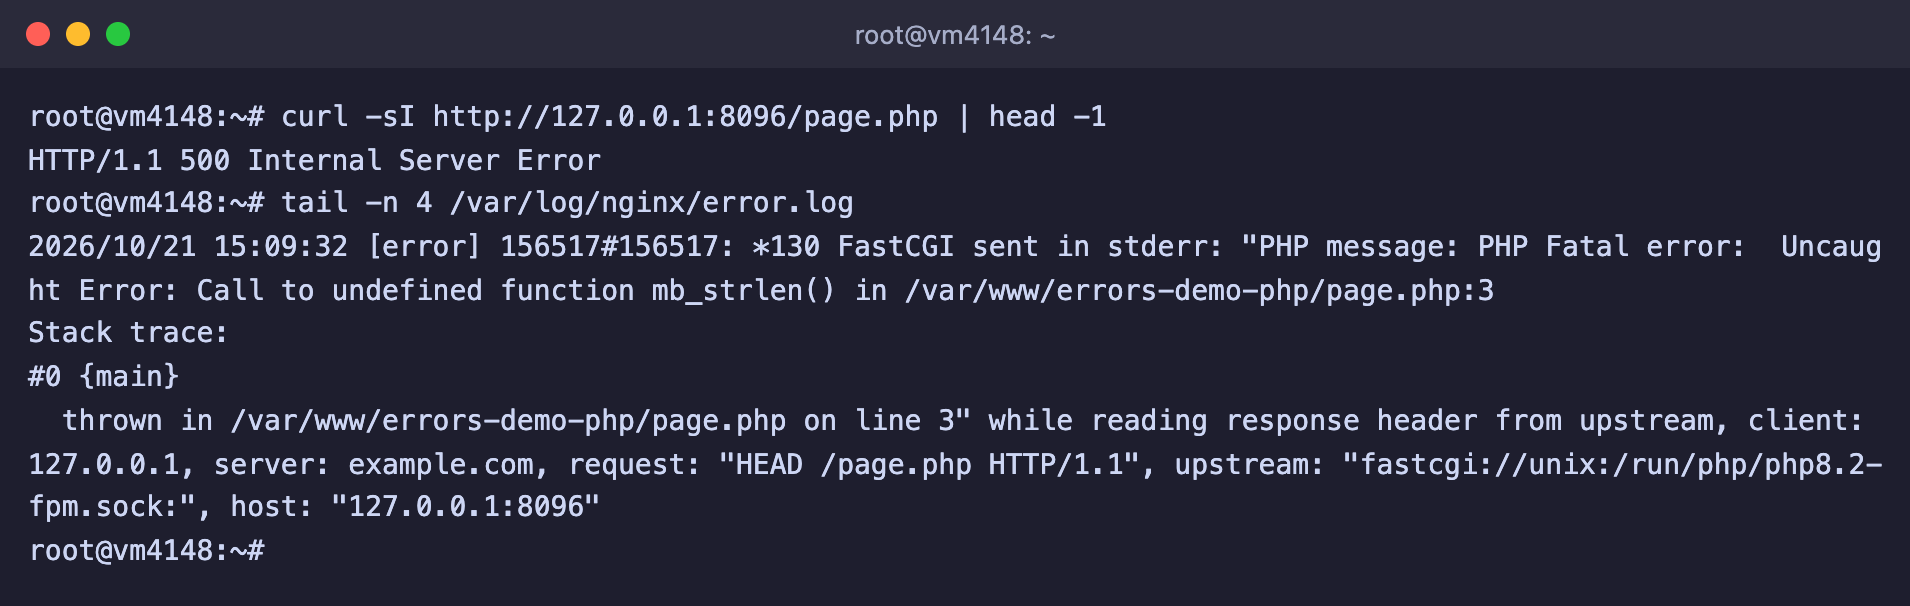
Code 500 and the log line with the PHP error text
The entry starts with the words FastCGI sent in stderr, and after them comes the PHP message itself. Read it like this. The error type is PHP Fatal error, then the essence, Call to undefined function mb_strlen(), meaning a function that does not exist was called, and at the end the file and line where it happened. In our example the mb_strlen() function belongs to the mbstring module, which is missing on a fresh PHP installation. This module is on the list that we recommend installing for WordPress in the article about installing Nginx. Install the missing module.
# Install the mbstring module for PHP
apt install -y php-mbstring
After the installation we did not restart anything, and the page started working right away.
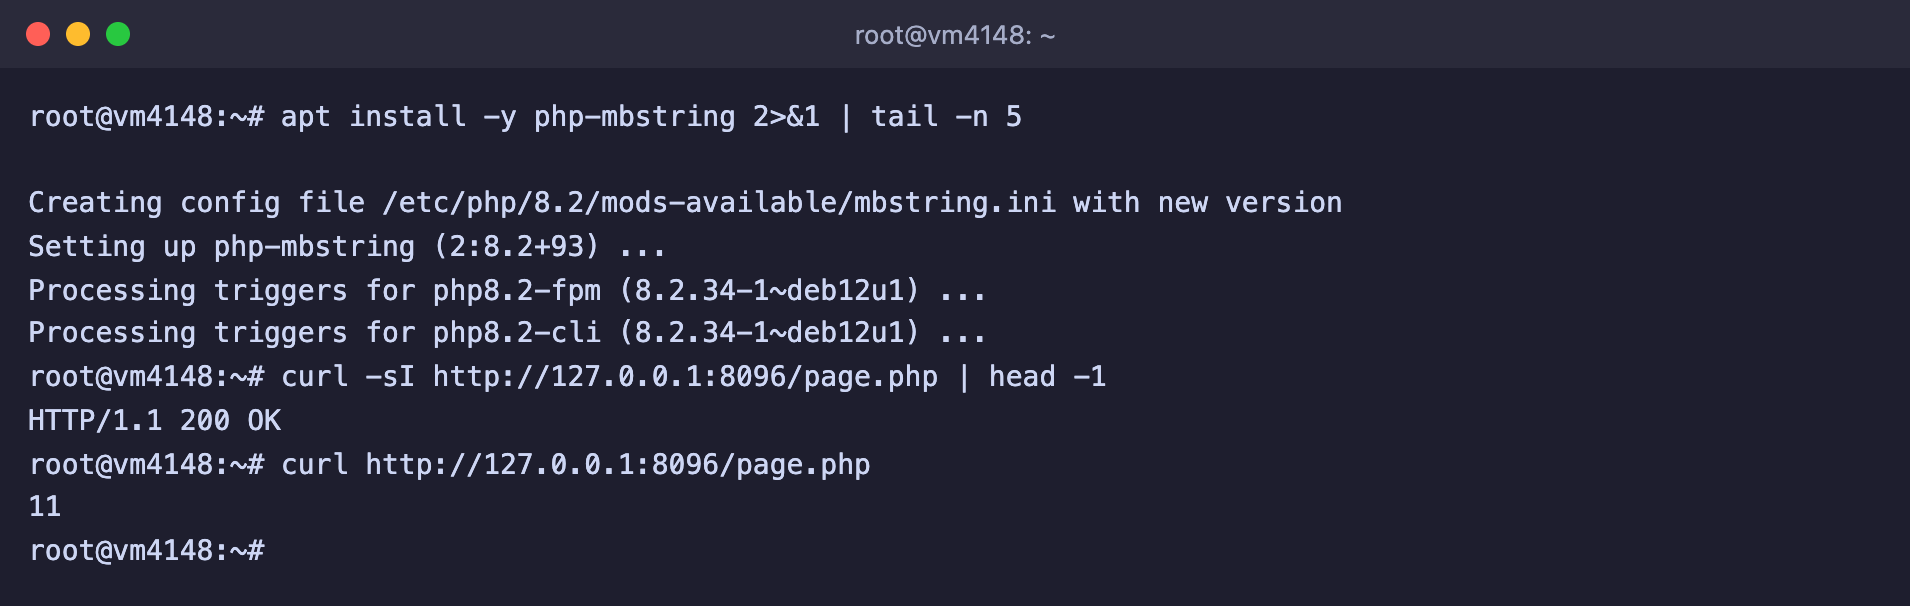
The module is installed, and the page returns 200 and the result of the function
Another common cause of 500 in PHP is a syntax error after editing a file. You can check a file on the server with the php -l command, and it will also tell you on which line the error is.
# Check the file syntax
php -l /var/www/errors-demo-php/parse.phpPHP Parse error: syntax error, unexpected token "echo", expecting "," or ";" in parse.php on line 3
Errors parsing parse.phpDo not turn on error display on a live site
You can turn on the display_errors parameter to see the error right in the browser, but you should not do this on a live site. The error text contains paths to files on the server, and any visitor will see it. The Nginx log gives the same information, but only to you.
Internal redirection loop
The second cause has nothing to do with the application at all, it is a mistake in the settings of Nginx itself. Take a setting where, for any address that has no matching file, the main page /index.html is served.
root /var/www/errors-demo-cycle;

location / {
    try_files $uri /index.html;
}
The last try_files parameter works as an internal redirect. Nginx starts processing again, now for the address /index.html, and lands in the same location again. If the index.html file exists, everything ends successfully. If it does not, for example the site build was forgotten or root points to the wrong place, Nginx redirects the request to /index.html again, and so on in a circle. According to the Nginx documentation, such a loop is stopped after ten attempts, and the client gets a 500 error.
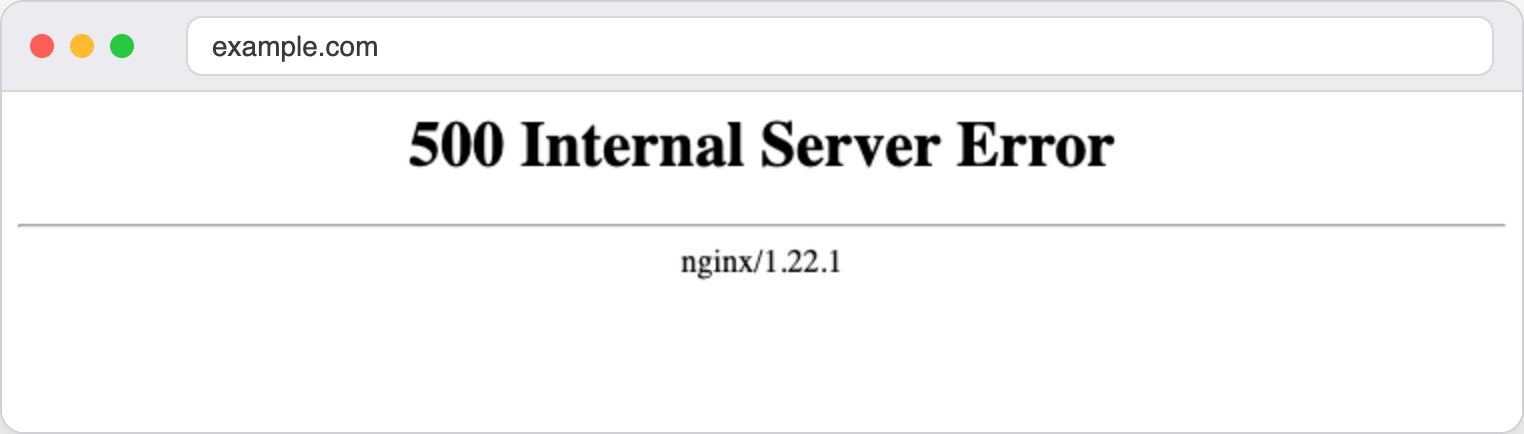
Here the 500 error was drawn by Nginx itself, so its version is visible at the bottom
In the log the entry says this directly.
2026/10/21 14:53:33 [error] 124894#124894: *11 rewrite or internal redirection cycle while internally redirecting to "/index.html", client: 127.0.0.1, server: example.com, request: "GET / HTTP/1.1", host: "example.com"The phrase rewrite or internal redirection cycle means a redirection loop, and in the quotes is the address that Nginx kept going around. Check whether such a file exists in the folder given in root, and upload it if needed.
# Look at what is in the site folder
ls -la /var/www/errors-demo-cycle

# Put the file in place
echo '<h1>Site works</h1>' > /var/www/errors-demo-cycle/index.html

# Check the response
curl -sI http://127.0.0.1:8097/ | head -1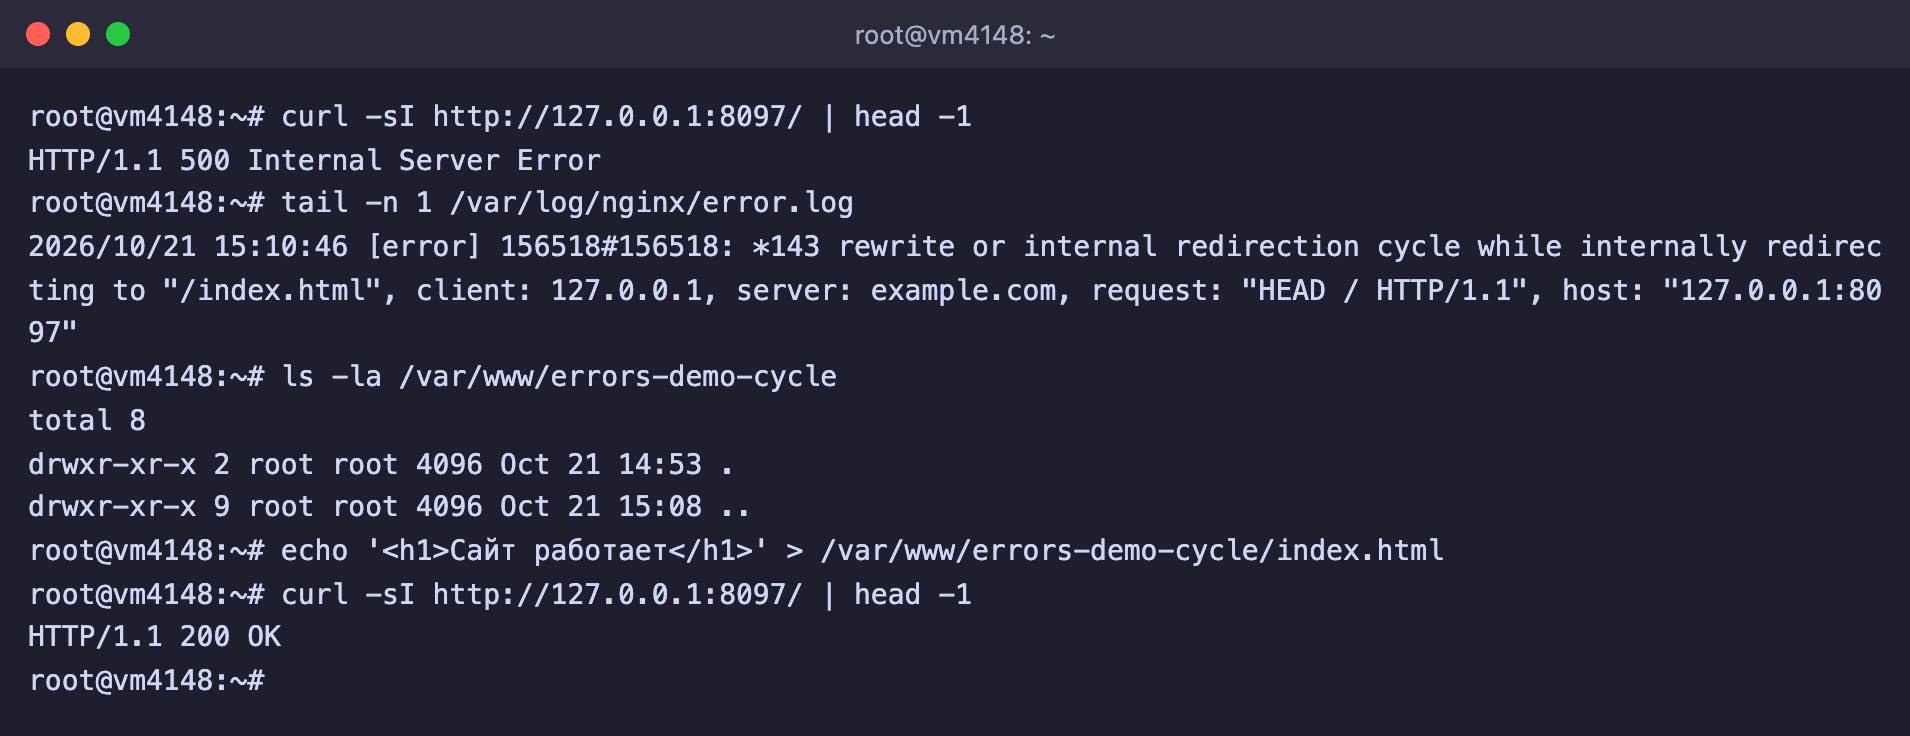
The loop stops as soon as the needed file appears in the site folder
After the file was created, the response became HTTP/1.1 200 OK. We did not need to reload Nginx for this, because what had to be fixed was the contents of the folder, not the settings.
Frequently asked questions
upstream prematurely closed connection while reading response header from upstream
This line in the log accompanies a 502 error. Nginx connected to the application and sent the request, but the application cut the connection without sending a response. For example, it could have crashed right while handling the request. Look at the service log with the command journalctl -u service-name -n 50 --no-pager, the cause should be there. We reproduced this with a line like upstream prematurely closed connection while reading response header from upstream, … request: "GET /close HTTP/1.1", upstream: "http://127.0.0.1:8098/close".
upstream sent too big header while reading response header from upstream
A 502 error appears when the application sends response headers that are too long, for example huge cookies. Nginx reads the first part of the response into a buffer whose default size is one memory page, that is, 4 or 8 KB. If the headers do not fit in it, the response is considered invalid. We checked this with a header 9000 characters long. Increase the buffer in the location block.
location / {
    proxy_pass http://127.0.0.1:8098;
    # A bigger buffer for the response headers
    proxy_buffer_size 16k;
    proxy_buffers 8 16k;
}
You must not skip the proxy_buffers 8 16k; line. When we added only proxy_buffer_size 16k;, nginx -t reported the error "proxy_busy_buffers_size" must be less than the size of all "proxy_buffers" minus one buffer, and such settings cannot be applied. With both lines the check passed, and the page opened with code 200.
nginx -t prints [emerg] after editing the settings
This means there is an error in the settings file, and Nginx will not apply such a configuration. Until you run systemctl reload nginx, the site keeps working with the old settings, so always run nginx -t && systemctl reload nginx rather than the reload command alone. The text of the message tells you what exactly is wrong. For example, "proxy_busy_buffers_size" must be less than the size of all "proxy_buffers" minus one buffer points to inconsistent buffer sizes in the location block.
The site shows an error but error.log is empty
Most likely this site has its own error log. It is set by the error_log directive in the server block, and then the entries go to the specified file instead of the shared error.log. We checked this. With the directive error_log /var/log/nginx/errors-demo.log; in the site block, the line about the 403 error appeared only in that file. You can find all the logs that Nginx knows about with the command below.
# Show all error_log directives in all settings
nginx -T 2>/dev/null | grep -n error_log
In our example the command printed error_log /var/log/nginx/error.log; from the main file and a line with the address of the site log.
curl: (7) Failed to connect to … port … Couldn't connect to server
This is no longer one of the four errors. Nginx did not send any response at all, because nobody listens on that port. In this case the browser shows its own page, in Chrome it is ERR_CONNECTION_REFUSED. We got this message when contacting a port that nobody was using, curl: (7) Failed to connect to 127.0.0.1 port 8090 after 0 ms: Couldn't connect to server. Check that Nginx itself is running with the command systemctl status nginx, and that ports 80 and 443 are open in the firewall.
PHP-FPM logs Maximum execution time of 30 seconds exceeded
The script ran for longer than the max_execution_time parameter allows, 30 seconds by default, and PHP stopped it. In this case Nginx returns 500, not 504. Open /etc/php/8.2/fpm/php.ini, increase the value of the parameter and restart the service with the command systemctl restart php8.2-fpm. If the script has to run for more than a minute, do not forget to raise fastcgi_read_timeout in the Nginx settings as well.
Our resources
Telegram channel: https://t.me/f3cloud_news
F3 Cloud: https://f3cloud.com