
Sometimes an application cannot reach its database, emails are not going out, and a client insists that their requests never reach the server. The logs stay silent in this situation, because the program does not even see the connection. This is where tcpdump helps. It shows the network packets that actually arrive at the server and leave it, and lets you say exactly whether a request got through and what the reply was. In this article we look at how tcpdump sees traffic, learn to write filters, view packet contents and save a capture to a file. All examples were taken on a test server with Debian 12.
How tcpdump sees traffic
Every packet that passes through a server's network interface is handled by the Linux kernel itself, and regular programs receive only the ready data of their own connections. tcpdump works differently. It asks the kernel to hand it a copy of every packet passing through the chosen interface, together with all of its headers. That is why it also sees packets that the firewall will later drop or that are addressed to a port where nothing is listening. This is exactly what makes it indispensable for troubleshooting. If a packet appears in the tcpdump output, it reached the server, and if it is not there, the problem has to be looked for earlier, in the network or on the sender's side.
Copying every packet into a program is expensive, and a busy server handles thousands of packets per second, so tcpdump is almost always run with a filter. A filter is written in a special language, for example port 53 or host 1.1.1.1 and tcp, and is executed right inside the kernel. The kernel passes only the matching packets to tcpdump and does not even copy the rest. Thanks to this, tcpdump is safe to run even on a production server.
It is also important to understand its limitation. tcpdump shows packets as they travel over the network. If a connection is encrypted, as with HTTPS or SSH, you will see the addresses, ports, sizes and timing, but not the contents. Only unencrypted protocols, such as plain HTTP or DNS, are visible in clear text. We checked this on a test server. An HTTP request to a website could be read in full in the tcpdump output, along with the page address and the headers.
1. Install tcpdump
tcpdump is not included in our Debian 12 image by default.
apt install -y tcpdumpThen find out the name of the network interface. You will need it in every command.
ip -br linkOn our servers the main interface is called ens3. The lo, docker0 and br-… interfaces belong to the server itself and to Docker. If you are not sure which interface you need, use -i any, and tcpdump will listen on all of them at once.
2. View packets by port
Let's start with DNS. Run tcpdump with a filter on port 53 and the -c option, which ends the capture after the given number of packets. In another window, or right after that, run dig example.com.
tcpdump -n -i ens3 port 53 -c 2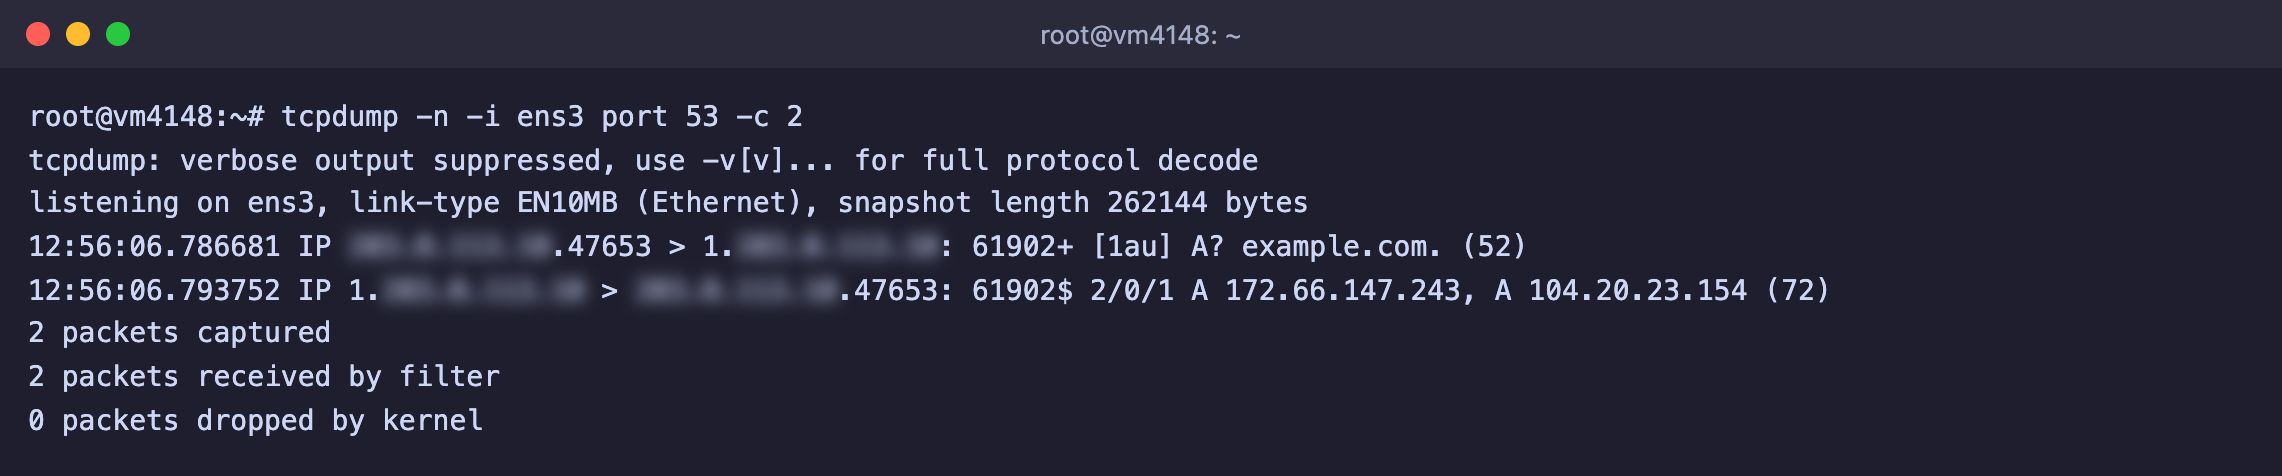
A query to a DNS server and a reply with two IP addresses
Each line is one packet.
- Time accurate to the microsecond.
- Sender and recipient in the form
address.port > address.port. - Contents in short form. For DNS this is the question itself,
A? example.com., and the reply with the addresses.
The -n option stops tcpdump from turning addresses into names. Without it, tcpdump makes DNS queries of its own, clutters the output and runs slower.
3. Build a filter
Filters are combined with the words and, or and not. If a filter contains parentheses or square brackets, put it in quotes.
# All traffic to and from a specific address
tcpdump -n -i ens3 host 203.0.113.10

# Only incoming connections to port 443
tcpdump -n -i ens3 dst port 443

# Database traffic, except your own SSH
tcpdump -n -i ens3 port 3306 and not port 22

# Only UDP or only ICMP, such as ping
tcpdump -n -i ens3 udp
tcpdump -n -i ens3 icmp

# New SSH connection attempts, that is, SYN packets
tcpdump -n -i ens3 "tcp[tcpflags] == tcp-syn and dst port 22"
The last filter is useful for seeing who is knocking on your server. On the test server it caught two SSH connection attempts in four minutes, both from scanners that try to guess passwords.
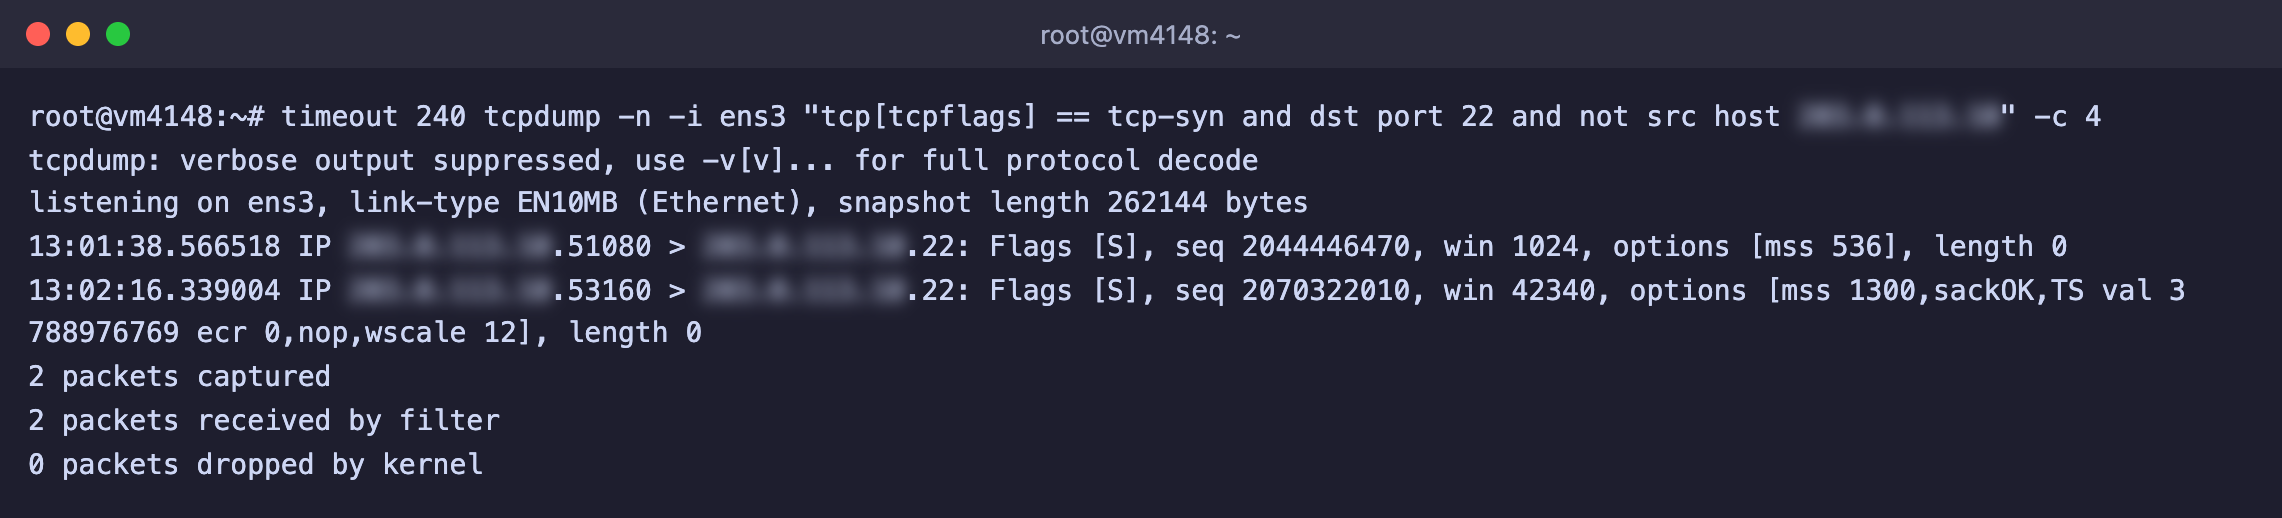
Packets with the [S] flag are the start of a new connection, the addresses are hidden
Don't capture your own SSH
If you are connected to the server over SSH and run tcpdump without a filter, it will also show the packets of your own connection, and every line it prints will generate new packets. Add and not port 22 to the filter.
4. View packet contents
The -A option prints packet contents as text. This is handy for unencrypted protocols. For example, this is how you can see HTTP requests to websites.
# All outgoing packets to port 80 with their contents
tcpdump -n -A -i ens3 "tcp dst port 80" -c 5

# Only packets with a GET request, as in the screenshot below
tcpdump -n -A -i ens3 'tcp dst port 80 and tcp[((tcp[12]&0xf0)>>2):4] = 0x47455420' -c 1
Over HTTP the request and the headers are visible in full
For encrypted protocols -A will show a meaningless jumble of characters, and that is normal. For binary protocols -X is more convenient than -A, as it shows the contents in hexadecimal next to the text.
5. Save the capture to a file
A long capture is easier to write to a file and analyze later, for example in Wireshark on your own computer.
# Write to a file, stop with Ctrl+C
tcpdump -n -i ens3 port 53 -w /tmp/dns.pcap

# Read the file on the server
tcpdump -n -r /tmp/dns.pcap
You can download the .pcap file from the server over SFTP or with the scp command and open it in Wireshark with a double click. Remember to delete it from the server once you are done, since the capture may contain something confidential.
Frequently asked questions
tcpdump: eth0: No such device exists
There is no interface with that name on the server. Many older guides use the name eth0, while on our servers the main interface is called ens3. Check the list of interfaces with ip -br link or run tcpdump with the -i any option.
You don't have permission to perform this capture on that device
Only root can capture packets. Run the command as root or with sudo.
tcpdump shows nothing
- Check that you chose the right interface. Docker container traffic, for example, goes through the
docker0andbr-…interfaces. - Loosen the filter. Start with one condition, such as
port 80, and add the others one at a time. - If no packets show up even with a simple filter, they are not reaching the server. Check the route as described in the article about traceroute, and check the firewall rules on the sender's side.
Our resources
Telegram channel: https://t.me/f3cloud_news
F3 Cloud: https://f3cloud.com