
The server suddenly started responding slowly, the site opens only every other time, and the graphs in the client area show the CPU maxed out. To understand what is going on, you need to see which programs are running right now and how many resources they take. In this article we explain what server load means and how to read load average, learn to use the top, htop and ps commands, find the process that is loading the system and end it. To make things clearer, we loaded a test server with 4 cores with two processes, each of which took up a whole core, and all the screenshots were taken at that moment.
What a process is and how to read the load
Every running program in Linux works as a process. A process has a number called the PID, the user it runs as, and a state. Most of the time almost all processes on a server are asleep. The web server waits for new connections, the database waits for queries, and at that moment they do not need the processor. The processor is used only by processes in the R (running) state, which are computing something right now or waiting in line to do so. It is their number that underlies the best-known load indicator.
This indicator is called load average and is shown as three numbers, for example 2.24, 1.03, 0.50. They are the average length of the queue of processes that need the processor over the last 1, 5 and 15 minutes. Linux also adds the processes that are waiting for a disk operation to finish and cannot be interrupted, so load average grows when the disk is slow too, even if the processor is free. On its own, load average tells you nothing until you compare it with the number of cores. Suppose the server has 4 cores. A load of 2 means that on average two processes were running and half of the cores were idle. A load of 4 means that all cores are fully busy, and a load of 8 means that there are two contenders for each core and processes wait in a queue, so everything starts responding more slowly. On our test server, two processes that each took a whole core gave a load average of 2.24 on 4 cores after a couple of minutes.
It is useful to read the three numbers together, because they show the direction. If the first number is noticeably higher than the third, the load went up recently and may still be growing. If the first is lower than the third, the peak has already passed. The nproc command shows how many cores the server has.
Besides the load, the processor has a time breakdown that top shows. The us value is the time spent on programs, sy is the time spent on the work of the system kernel, id is idle time, and wa is waiting for the disk. For a virtual server the st (steal) value also matters. It shows the share of time when the server was ready to work but the physical processor was busy with other tasks. On our test server it was zero.
1. Check the overall load
The quickest check is the uptime command. It shows how long the server has been running without a reboot and the three load average numbers.
uptime
nproc
Compare the first load average number with the number of cores from the nproc output. If the load is noticeably higher, look for what is causing it.
2. Find the process in top
The top command is available on any server and shows processes in real time. The -o %CPU option sorts them by CPU load.
top -o %CPU
The overall load is at the top, the processes are below, with the hungriest ones first
The top part shows load average, the number of processes, the CPU time breakdown and memory. In the table below, a few columns are the most interesting.
- PID is the process number, you will need it to end the process.
- USER shows which user the process runs as.
- %CPU is the CPU load. 100 % means one whole core, so on a multi-core server a process can show more.
- RES shows how much RAM the process actually takes.
- COMMAND is the program name.
While top is open, the M key sorts processes by memory, P sorts them by CPU again, and q closes the program.
3. Install htop
htop shows the same thing but more clearly, with colored bars for each core and for memory. Our servers with Debian 12 do not have it by default, so install it.
apt install -y htop
htop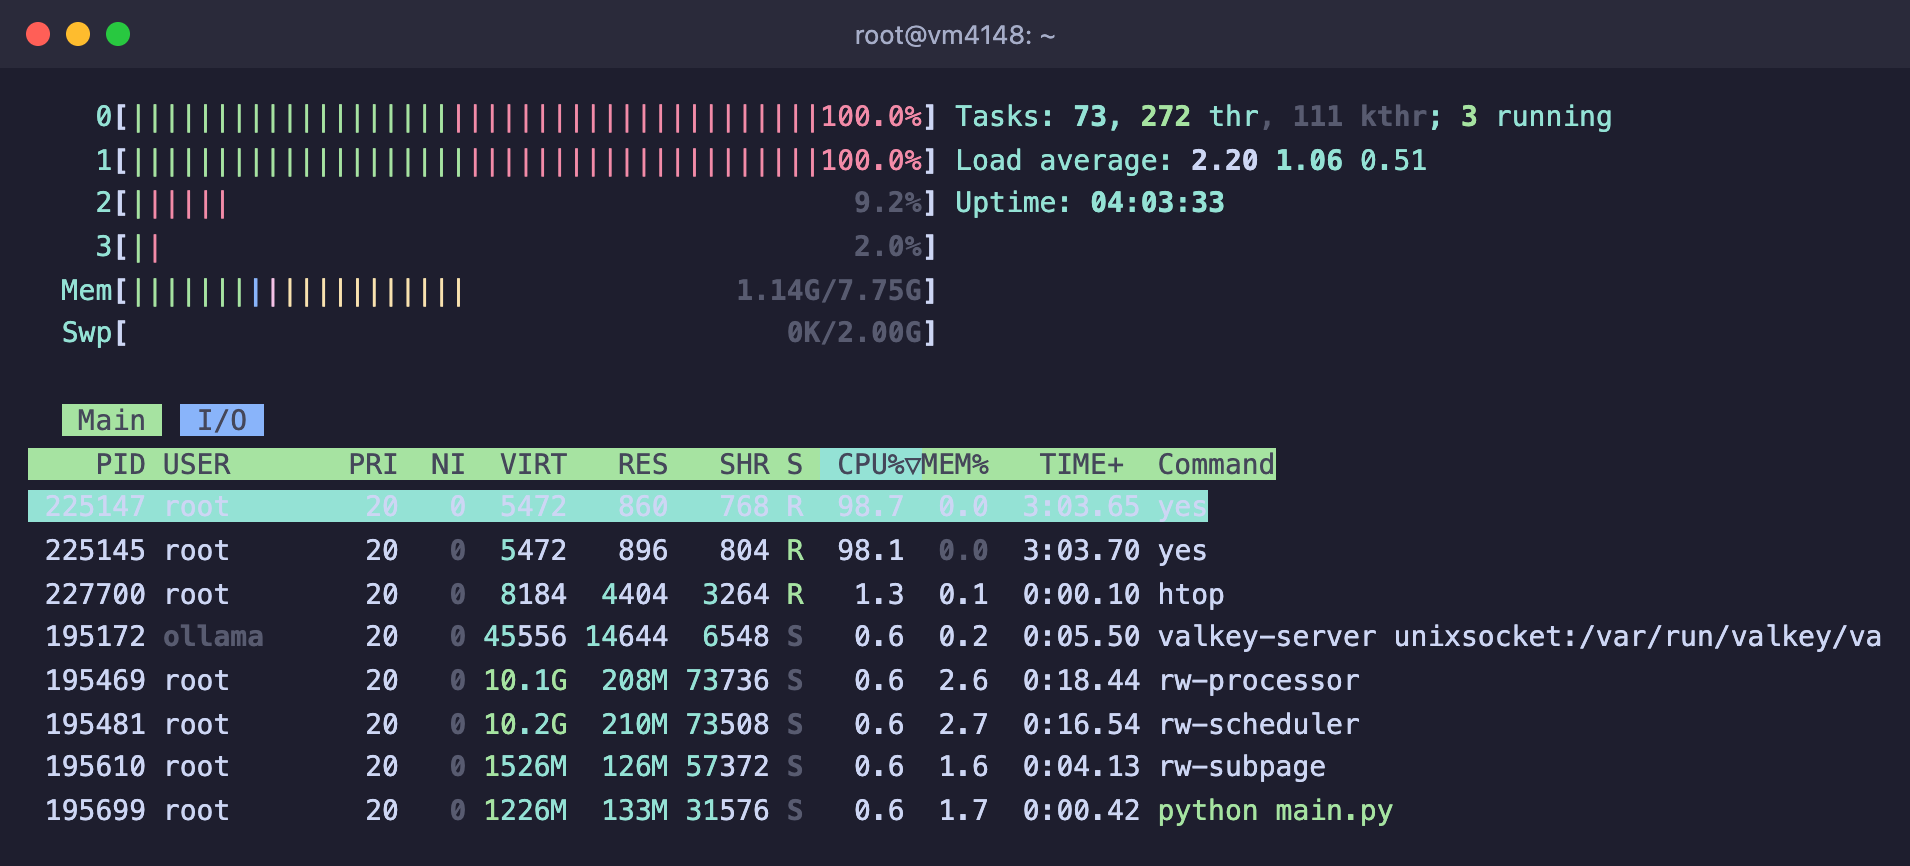
Two cores are fully loaded, two are almost free
In htop you can select processes with the arrow keys. The F6 key chooses the column to sort by, F9 ends the selected process, F5 shows processes as a tree, and F10 or q closes the program. If you work through Termius on a phone, where there are no F keys, tap the labels at the bottom of the screen.
4. Get a list of processes with ps
top and htop are handy for watching, while ps is better for searching and for scripts. It prints the list once and exits.
# Five processes that load the CPU the most
ps aux --sort=-%cpu | head -6

# The same by memory used
ps aux --sort=-%mem | head -6

# Find a process by name and show its PID
pgrep -a nginx
5. End the process
Once you have found the culprit, you can end it by its PID or by name.
# Politely ask the process to exit
kill 225145

# End all processes with this name
pkill yes
The processes were found by name and ended
Without options, the kill command sends the process the TERM signal. When it receives this signal, the program can save its data, close its files and exit on its own. If the process does not respond, use the KILL signal, which the system carries out forcibly without asking the program.
kill -9 225145Try a regular kill first
kill -9 does not let the program save its data, so a database or website may lose its latest changes after being stopped this way. Use it only when a regular kill did not help. Services such as Nginx or MySQL are better restarted with the systemctl restart command than ended manually.
Frequently asked questions
The load is high, but top shows no processes with high %CPU
Look at the wa value in the %Cpu(s) line. If it is high, processes are waiting for the disk rather than the processor, and they are the reason load average grows. To find out which process reads and writes the most, use the I/O tab in htop or the iotop program, which you can install with apt install -y iotop.
The process ended but came back a minute later
Most likely it is a service that the system restarts automatically, or a task started by cron. Find out which service the process belongs to with the systemctl status PID command and stop the service itself.
What is a zombie in the top output
It is a process that has already ended, but its parent has not yet collected its exit code. A zombie takes no memory or CPU time and usually disappears on its own. If there are more and more such processes, the problem is in the parent program, and restarting it helps.
The server is constantly overloaded
If the CPU or memory is constantly busy with the normal work of your programs, the server does not have enough resources. A swap file can help with memory, but moving to a more powerful plan is more reliable. How to do this is explained in the frequently asked questions.
Our resources
Telegram channel: https://t.me/f3cloud_news
F3 Cloud: https://f3cloud.com