
OpenTelemetry helps you see what is happening inside an application and on a server. A program sends request traces, metrics and log records to a single place, and from there they can be passed on to any storage and viewed on timelines and charts. The main middleman in this scheme is called the OpenTelemetry Collector, and that is what we will run on the VPS. In this article we will start the Collector and Jaeger with Docker Compose, send test data, connect a Python application without changing its code, open a trace in the browser and add metrics of the server itself. We repeated every step on a test server with Debian 12. The Collector version at the time of testing was 0.163.1 and the Jaeger version was 2.22.0.
How OpenTelemetry works
As long as an application consists of one process, a log usually helps you understand its behavior. But when a request passes through several services, for example a web application, a queue and a database, a log is no longer enough. You want to see the path of a specific request and find out how much time it spent on each step, and at the same time understand whether the server itself is running out of memory or disk. The data that programs and servers produce about their own work is called telemetry. OpenTelemetry, or OTel for short, is an open set of specifications, programming interfaces and tools that describes how to create, transmit and collect telemetry. It is not tied to a particular vendor, so the same data can be sent to Jaeger, to Prometheus or to a commercial service. At the same time, it is worth seeing the boundary right away. By the definition in the official documentation, OpenTelemetry is not an observability backend, which means it does not store data itself and does not draw charts, and it leaves storage and display to other programs.
Telemetry is divided into signals of three main kinds. A trace describes the path of one request through the application. It consists of spans, and each span represents a separate unit of work inside a request, for example handling an HTTP request or a call to a database. A span has a name, a start and end time, attributes and identifiers. All spans of one trace carry a shared trace ID, and a nested span has the ID of its parent. Jaeger later draws the call tree from exactly these links, and we will see it in step 5. A metric is a measurement taken while the system is running, for example used memory or the number of requests. Unlike a trace, it describes the behavior of the system as a whole rather than of one request, and so it is well suited to charts and alerts. A log is a record of an event. So as not to force you to give up familiar logging libraries, OpenTelemetry hooks into them, and when the SDK or automatic instrumentation is enabled in the application, the IDs of the active trace and span are added to log records by themselves. Thanks to this, a log line can be linked to the request during which it appeared.
Now let's see how data leaves the application. The code itself uses the API, which defines how to create telemetry, and the SDK is responsible for its implementation in a specific language. The SDK collects the spans and metrics that were created, processes them and exports them. You do not have to write tracing by hand for every framework, because there are instrumentation libraries that create spans for requests of popular libraries on their own, and in languages where this is supported they are connected with no code changes at all. That is exactly what we will do with the Flask application. The SDK sends data using the OTLP protocol, which has two transport options. OTLP/gRPC uses port 4317 by default and OTLP/HTTP uses port 4318, with data over HTTP going to the paths /v1/traces, /v1/metrics and /v1/logs. These are two different protocols on two different ports, and it is very easy to mix them up. In the frequently asked questions section we reproduced which errors appear in that case.
An application can be configured to send data straight to a storage, and for getting to know OpenTelemetry or for a small test setup this is acceptable. In most cases, however, a Collector is run next to the services, a separate intermediary program that receives telemetry, processes it and forwards it. This makes things simpler for the application, because it hands the data over quickly and forgets about it, while retries, batching, encryption and filtering of sensitive data are taken over by the Collector. Inside, it is built as a set of pipelines, one for each signal. A pipeline starts with receivers, which receive data, for example over OTLP or from server metrics. Then come processors, which change data along the way, for example put it into batches. The pipeline ends with exporters, which send the result to one or more storages. There is a subtlety that beginners trip over. It is not enough to describe a component in its own configuration section, it must also be listed in the service section, otherwise it will not be enabled. We will see this in the configuration of step 2. The Collector is released in several builds, and we will take contrib, which has far more receivers than the base one. In the 0.163.1 images there are 108 receivers versus 7.
The role of Jaeger in the scheme
Jaeger is an open system for storing and viewing traces. In our scheme it plays the role of the storage and the web interface, and it is not part of OpenTelemetry itself. Jaeger 2.22.0 accepts data over OTLP, and its log shows the lines Starting GRPC server and Starting HTTP server, so the Collector will pass traces to it using the same protocol.
What you need
- A server with Debian 12 and at least 2 GB of memory, for example the DE-RZ9-1 plan. On our server the Collector took from 45 to 70 MB of memory, Jaeger from 20 to 60 MB, and the demo Flask application about 120 MB. The Docker images took about 750 MB of disk space, and the Python virtual environment another 67 MB. If you do not have a server yet, order one using the guide.
- An SSH connection, for example via Termius. Commands are run as
root. - Docker and Docker Compose. How to install them is described in a separate article. We had Docker 29.9.2 and Compose 5.6.1.
- Python 3 for the demo application. It is already included in Debian 12, our version is 3.11.2.
- A terminal and a browser on your computer to open Jaeger through an SSH tunnel.
Step 1. Prepare the folder and the Compose file
Create the project folder and go into it.
mkdir -p /opt/otel
cd /opt/otel
Now create the compose.yaml file. Copy the block below in full, together with the cat line at the start and EOF at the end, and paste it into the terminal window.
cat > compose.yaml <<'EOF'
# Jaeger stores and shows traces, the Collector receives telemetry
services:
  jaeger:
    image: cr.jaegertracing.io/jaegertracing/jaeger:2.22.0
    container_name: otel-jaeger
    restart: unless-stopped
    ports:
      - "127.0.0.1:16686:16686"   # Jaeger web interface, from the server itself only

  collector:
    image: otel/opentelemetry-collector-contrib:0.163.1
    container_name: otel-collector
    restart: unless-stopped
    volumes:
      - ./otel-config.yaml:/etc/otelcol-contrib/config.yaml:ro
    ports:
      - "127.0.0.1:4317:4317"     # OTLP gRPC
      - "127.0.0.1:4318:4318"     # OTLP HTTP
    depends_on:
      - jaeger
EOF
The file describes two containers.
- jaeger stores traces and shows them in the web interface. Its port 16686 is published only on the server's internal address
127.0.0.1. - collector receives telemetry. Its ports 4317 (OTLP/gRPC) and 4318 (OTLP/HTTP) are also published only on
127.0.0.1, so applications on the server itself can reach it, but it is not available from the internet.
The Collector settings file is mounted into the container read-only, and we will create it in the next step. The image versions are given explicitly, so that after a restart you get the same version and not a new one.
Why the ports are bound to 127.0.0.1 only
The Collector from this article has no passwords, and anyone who can connect to its port can send data to it. The official OpenTelemetry documentation advises publishing the Collector port in Docker only on 127.0.0.1 if it is used by programs from the same server. On top of that, the UFW firewall does not close Docker ports by itself, which is covered in detail in the article about Docker. We checked from a home computer that connections to ports 4317, 4318 and 16686 on the server's external address are not established and end with a timeout.
Step 2. Write the Collector configuration
Create the otel-config.yaml file in the same way, copying the block in full.
cat > otel-config.yaml <<'EOF'
receivers:
  # Receive telemetry from applications over the OTLP protocol
  otlp:
    protocols:
      grpc:
        endpoint: 0.0.0.0:4317
      http:
        endpoint: 0.0.0.0:4318

processors:
  # Collects data into batches, which makes sending more efficient
  batch:

exporters:
  # Traces go to Jaeger
  otlp_grpc/jaeger:
    endpoint: jaeger:4317
    tls:
      insecure: true
  # Everything the Collector has received is printed to its log
  debug:
    verbosity: basic

service:
  pipelines:
    traces:
      receivers: [otlp]
      processors: [batch]
      exporters: [otlp_grpc/jaeger, debug]
    metrics:
      receivers: [otlp]
      processors: [batch]
      exporters: [debug]
    logs:
      receivers: [otlp]
      processors: [batch]
      exporters: [debug]
EOF
Let's go through the file section by section.
- receivers describes the receivers. The
otlpreceiver waits for data on ports 4317 (gRPC) and 4318 (HTTP). The address0.0.0.0means that data is accepted on all addresses inside the container, while access from outside is limited by how we published the ports incompose.yaml. - processors describes the processors. The
batchprocessor puts data into batches before sending. - exporters describes the exporters. The name
otlp_grpc/jaegerconsists of a type and its own name after the slash, so you can keep several exporters of the same type. The addressjaeger:4317is the name of the service fromcompose.yaml, and Docker finds the container by that name by itself. Theinsecure: trueline turns off encryption, because the exchange happens inside the Docker network on one server. Thedebugexporter prints everything it receives to the Collector log, and thebasicmode outputs one line per batch of data. - service assembles the pipelines. For each signal it states where to take the data from, how to process it and where to send it. Traces go both to Jaeger and to the log, while metrics and logs so far go only to the log.
Do not remove the 0.0.0.0 address
If you do not set an endpoint for a receiver, the Collector listens only on the container's internal address 127.0.0.1, and the published ports stop working. We checked this on the test server, with details in the frequently asked questions section.
Component names in old guides
In version 0.163.1 the OTLP gRPC exporter is called otlp_grpc and the server metrics receiver is called host_metrics. Older guides use the names otlp and hostmetrics. The configuration check accepts those too, but we use the new names.
Step 3. Check the configuration and start
Before starting the Collector, check the settings file. The command below runs a one-off Collector container with your file and simply reports whether the configuration is valid.
docker compose run --rm --no-deps collector validate --config=/etc/otelcol-contrib/config.yaml
echo $?
If everything is fine, the command prints nothing, and echo $? shows 0. If there is an error in the file, you will see its text, and examples are in the frequently asked questions section. Now start the containers.
docker compose up -dThe first time you run it, Docker will first download the images. After a few seconds look at the last line of the Collector log.
docker logs otel-collector 2>&1 | tail -n 1You need the line Everything is ready. Begin running and processing data., which means the receivers are running.
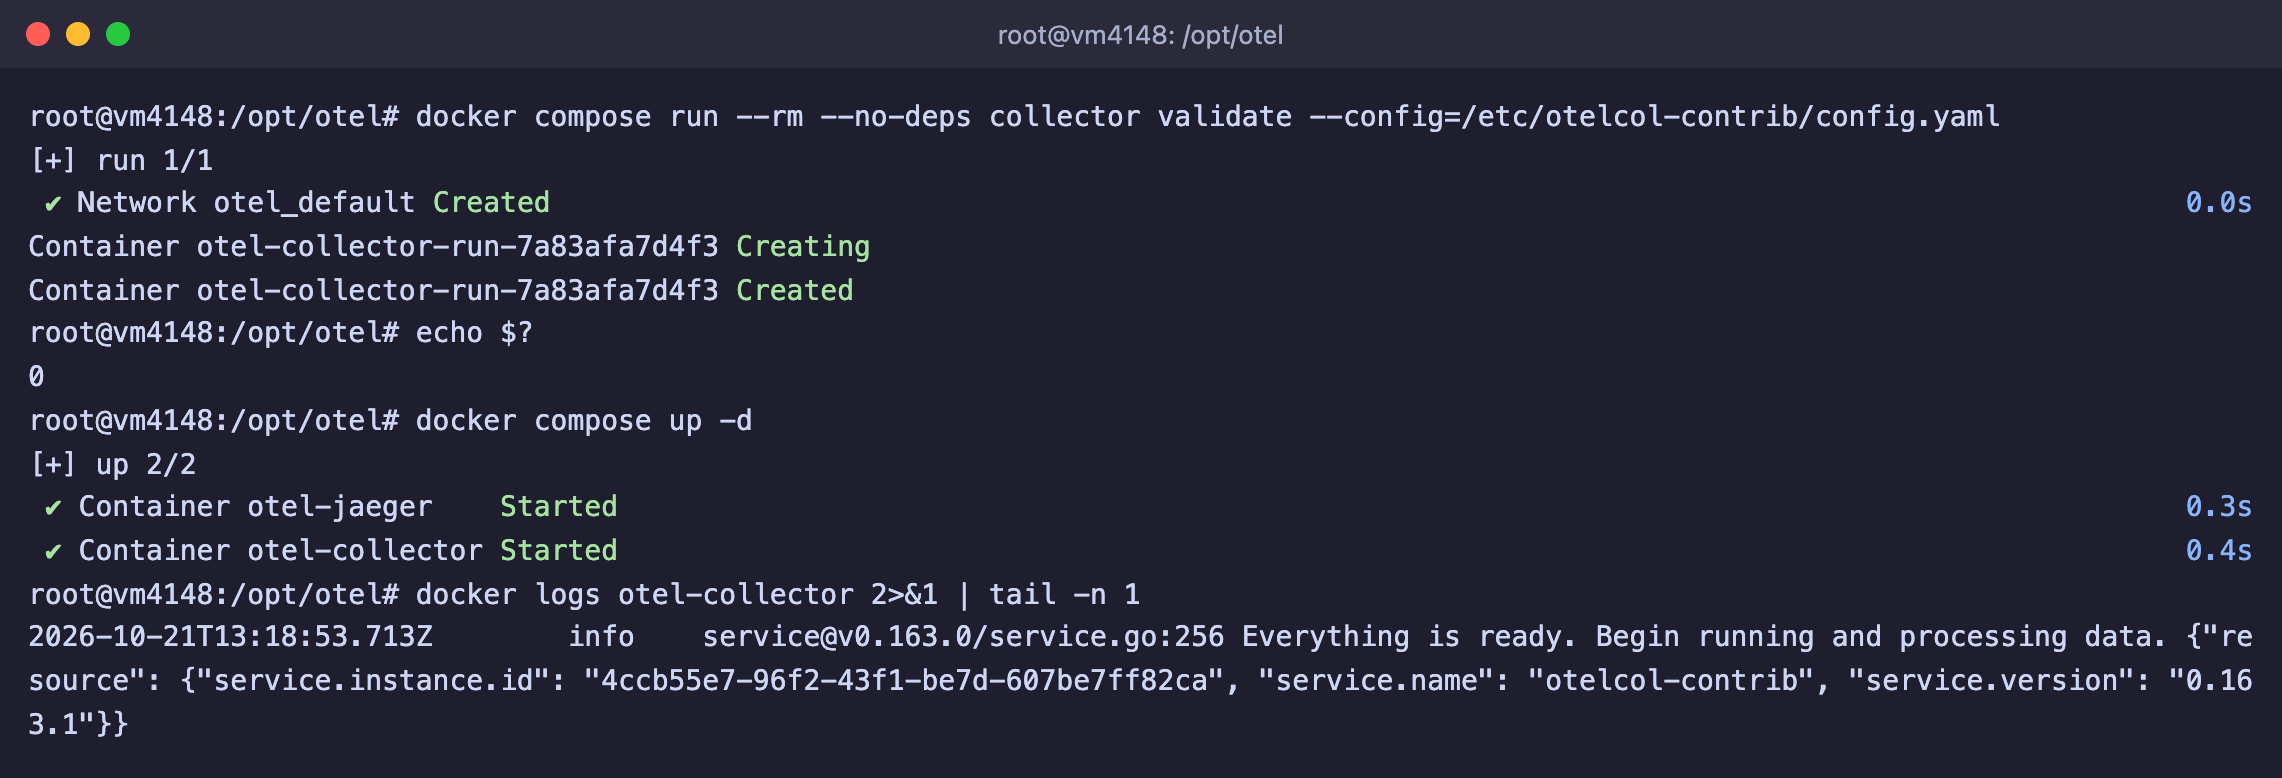
The configuration is valid, the Collector is running and ready to receive data
The Collector log lines are long, because each one ends with a service block describing the Collector itself. What matters to us is the beginning of the line and the numbers at the end.
Step 4. Send test traces
To check the Collector before connecting a real application, we will take the telemetrygen tool. It is part of the OpenTelemetry project and can generate test traces, metrics and logs. We will run it in a container in the server's network and send three traces.
docker run --rm --network host \
  ghcr.io/open-telemetry/opentelemetry-collector-contrib/telemetrygen:latest \
  traces --otlp-insecure --traces 3 2>&1 | grep -E "generated|export:"
--network hostgives the container the server's own network, so the tool can see port127.0.0.1:4317.--otlp-insecureturns off encryption. Our Collector has none, and without this parameter the tool will try to connect over TLS and get an error.--traces 3sets the number of traces. The tool creates one trace per second, so three traces take about 5 seconds.- The
grepfilter keeps only the final line and the lines with sending errors. The tool is very talkative.
The line traces generated only means that the tool created the data. Whether it reached the Collector is shown by its log.
docker logs otel-collector 2>&1 | grep Traces | tail -n 2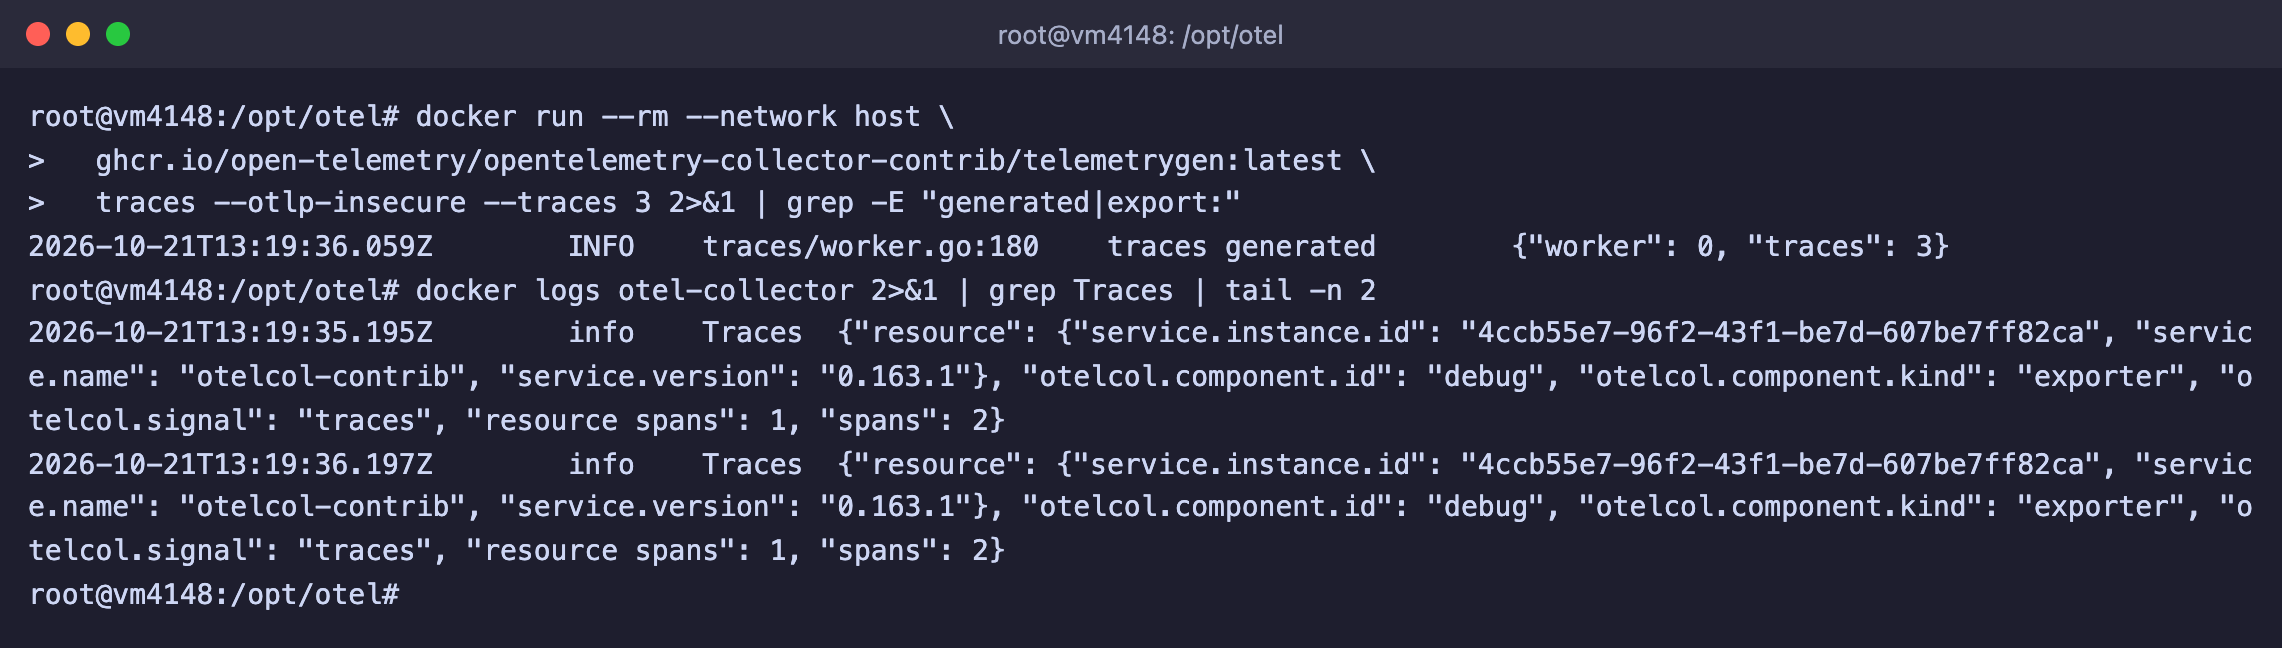
The Collector received the traces and wrote them to its log
Each Traces line says "spans": 2. The tool creates a trace of two spans, and the Collector receives traces as they appear and prints one line per batch.
The same test can be run over HTTP. To do that, add the --otlp-http parameter and specify port 4318.
docker run --rm --network host \
  ghcr.io/open-telemetry/opentelemetry-collector-contrib/telemetrygen:latest \
  traces --otlp-http --otlp-insecure --otlp-endpoint localhost:4318 --service telemetrygen-http --traces 2
The --service parameter sets the service name under which the traces will appear in Jaeger, so they are easy to tell apart from the first ones.
Step 5. Open Jaeger through an SSH tunnel
The Jaeger web interface is closed off from the internet, so you need to connect to it through an SSH tunnel.
On your computer, open a new terminal window and create the tunnel. Replace
server-IPwith the address of your VPS.bashssh -L 16686:127.0.0.1:16686 root@server-IPWithout closing this window, open the address
http://127.0.0.1:16686in the browser on your computer.In the Service list choose
telemetrygenand click Find Traces.
A page with the found traces will open. We sent three traces, and all three are visible in the table. Each has two spans, and the duration is about 123 microseconds, because telemetrygen creates very short spans by default.
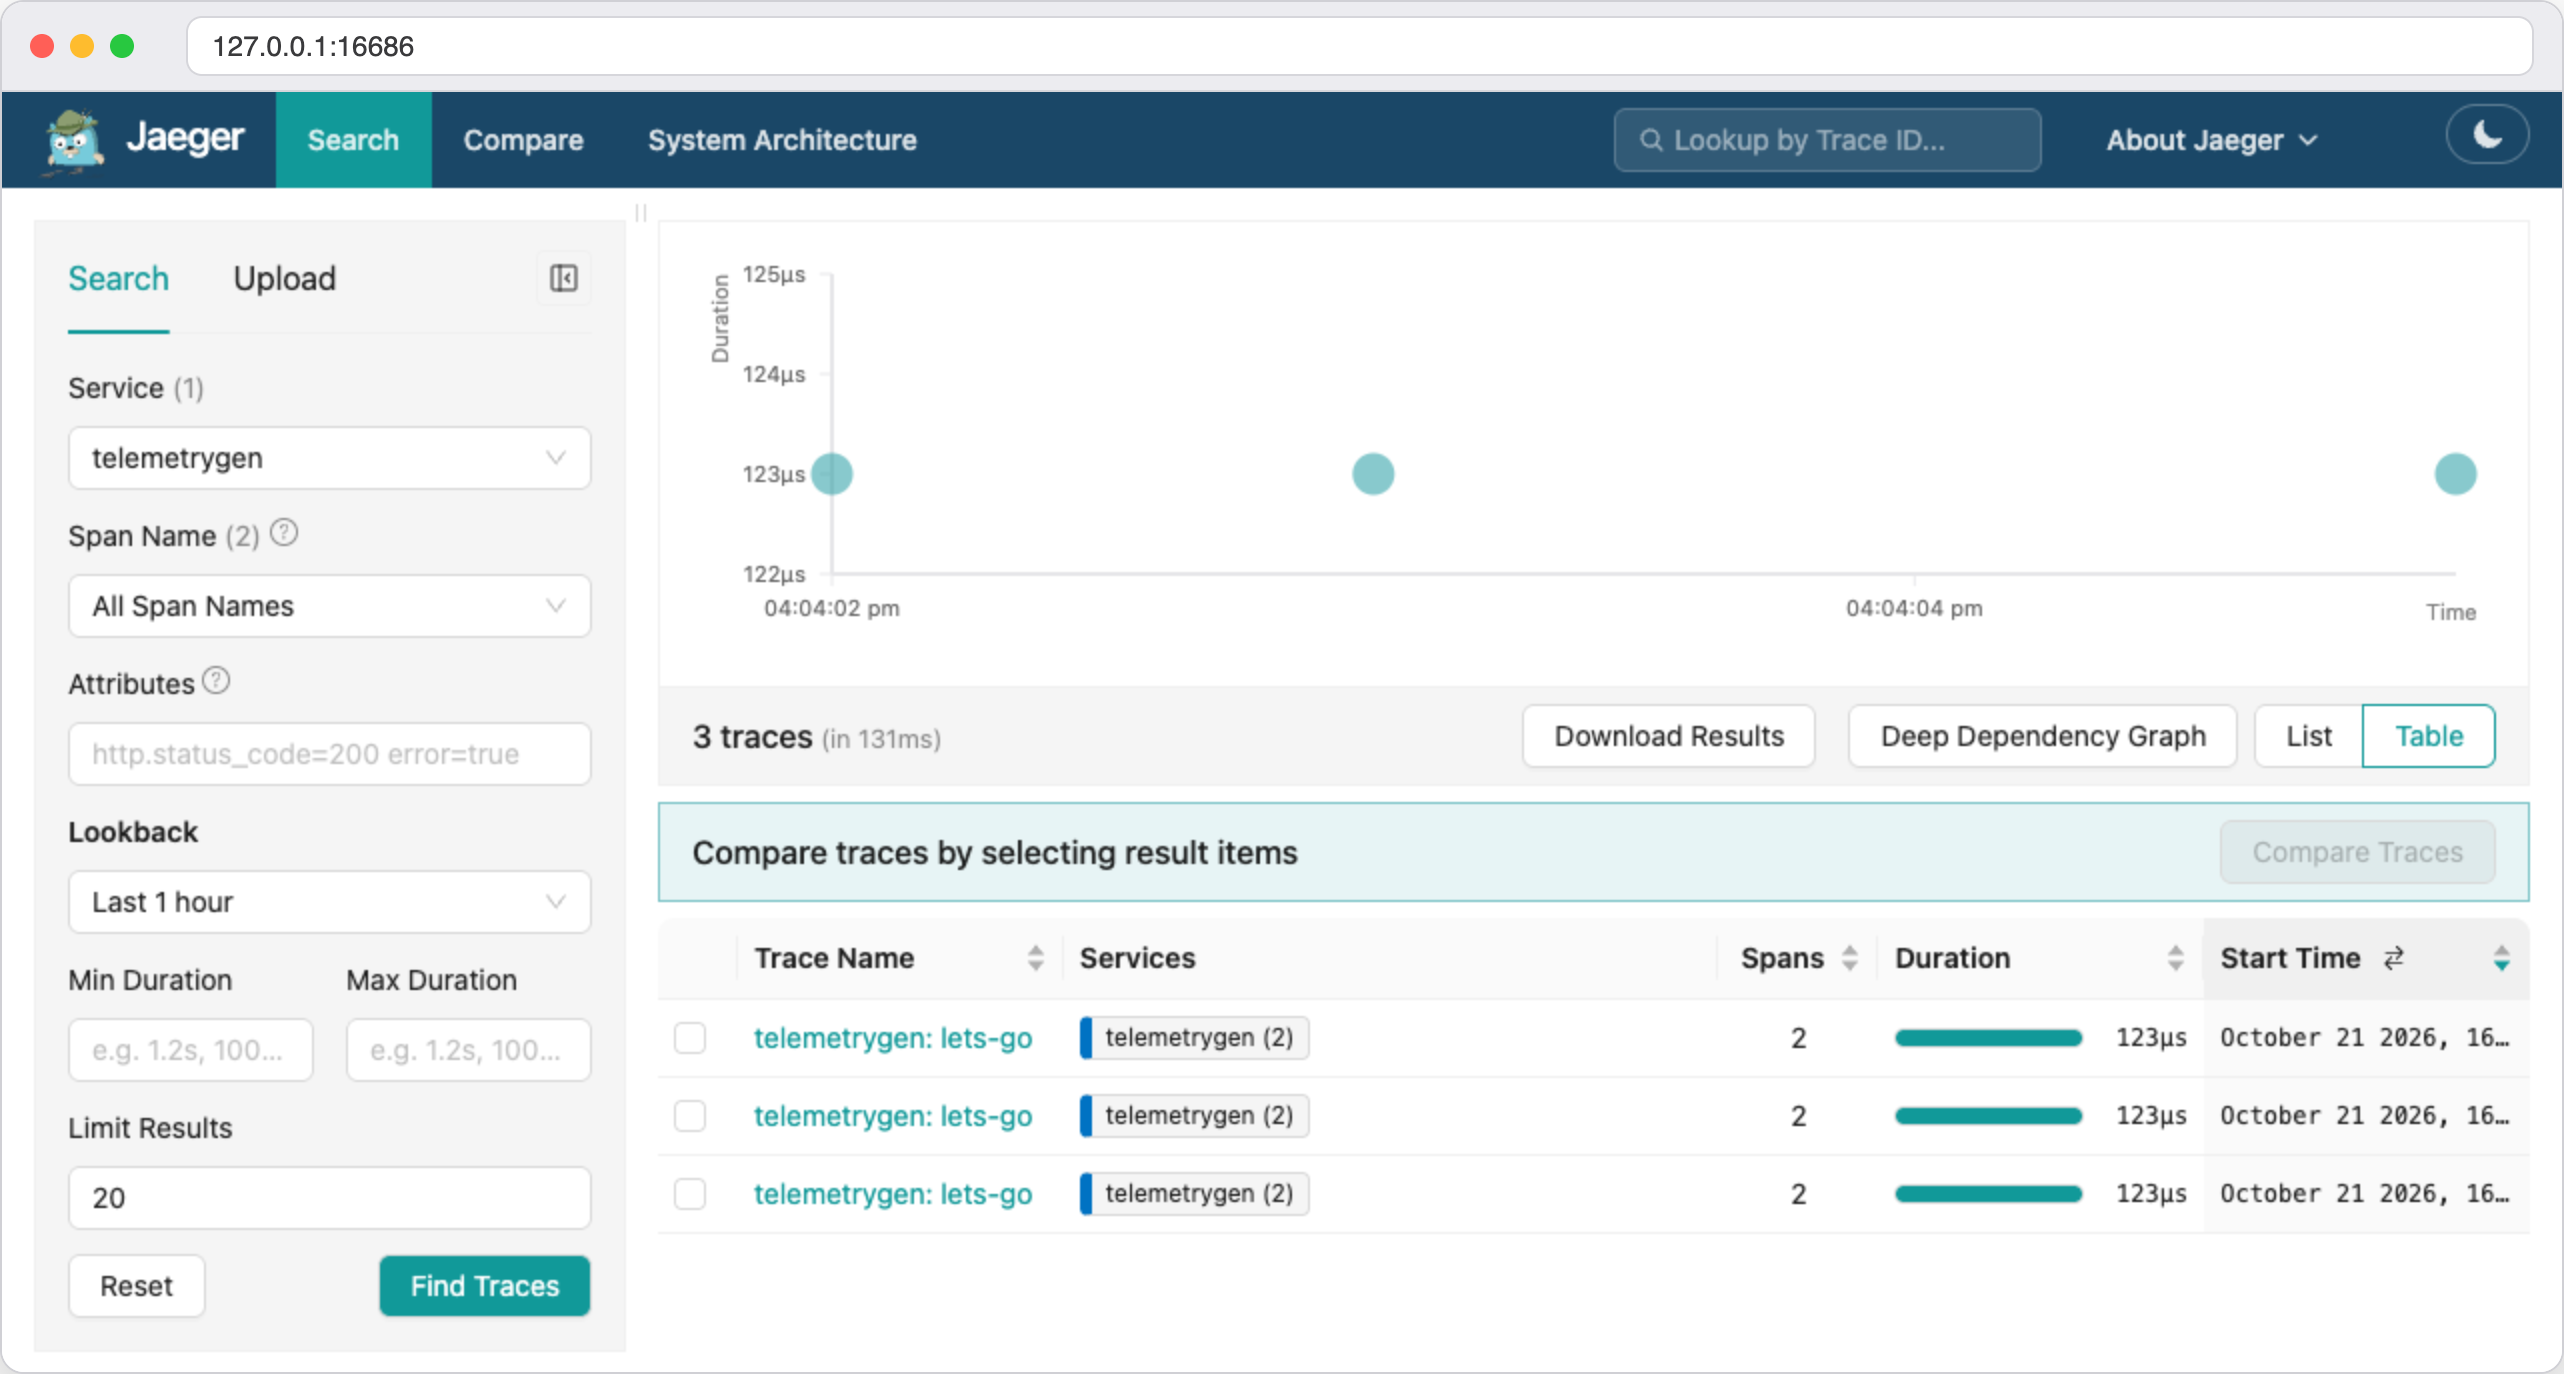
Test traces from telemetrygen in Jaeger
Click the name of any trace, and its timeline with the spans inside will open.
Jaeger keeps traces in memory only
In the mode from our Compose file, Jaeger does not write data to disk. According to its documentation, this is a temporary in-memory storage. We checked this by restarting the container, after which the earlier traces disappeared. Persistent trace storage is not set up in this article, and memory is enough for getting acquainted and for debugging.
Step 6. Connect a Python application
Test data is good for checking, but the real value begins when your application sends the telemetry. We will take a small Flask web application and connect OpenTelemetry to it without changes to its logic. We based it on the example from the official OpenTelemetry guide for Python, to which we added our own span and a small pause to make the trace easier to read.
Install the package for Python virtual environments. In Debian 12 it is not part of the standard installation.
bashapt install -y python3-venvCreate the application folder and a virtual environment, and then activate it.
bashmkdir -p /opt/otel/app cd /opt/otel/app python3 -m venv venv source venv/bin/activateThe
(venv)mark will appear at the start of the terminal line.Install Flask, OpenTelemetry and the OTLP exporter. Then run
opentelemetry-bootstrap, which finds the libraries already installed in the environment, for example Flask, and installs instrumentation packages for them.bashpip install flask opentelemetry-distro opentelemetry-exporter-otlp opentelemetry-bootstrap -a installOn our server Flask 3.1.3, OpenTelemetry SDK 1.45.1 and opentelemetry-distro 0.66b1 were installed.
Create the application file
app.py.bashcat > app.py <<'EOF' import logging import time from random import randint from flask import Flask, request from opentelemetry import trace app = Flask(__name__) logger = logging.getLogger(__name__) tracer = trace.get_tracer("diceroller.tracer") @app.route("/rolldice") def roll_dice(): player = request.args.get("player", default=None, type=str) result = str(roll()) if player: logger.warning("%s is rolling the dice: %s", player, result) else: logger.warning("Anonymous player is rolling the dice: %s", result) return result def roll(): # A section of the trace inside the request with tracer.start_as_current_span("roll") as span: time.sleep(0.3) # simulating work value = randint(1, 6) span.set_attribute("roll.value", value) return value EOFThe application answers at the
/rolldiceaddress with a random number from 1 to 6. Its only call to OpenTelemetry is therollspan, which we created ourselves so that we could see a nested section. Everything else will be done by automatic instrumentation.Start the application through
opentelemetry-instrument.bashopentelemetry-instrument --service_name dice-server --logs_exporter otlp flask run -p 8000--service_name dice-serversets the service name in Jaeger.--logs_exporter otlpenables sending logs. According to the documentation, traces and metrics go over OTLP/gRPC tolocalhost:4317even without this parameter.flask run -p 8000is the usual command to start the application. If port 8000 is taken on your server, choose another one.
The window will stay almost empty, and that is normal. The application's log records are now collected by OpenTelemetry and sent to the Collector, and they are not printed to the terminal.
Open a second SSH window and call the application a few times.
bashfor p in Anna Boris Clara; do curl "http://127.0.0.1:8000/rolldice?player=$p"; echo; doneEach response is delayed by about a third of a second because of the pause in the code. After a few seconds check the Collector log.
bashdocker logs otel-collector 2>&1 | grep -E "Traces|Logs" | tail -n 2
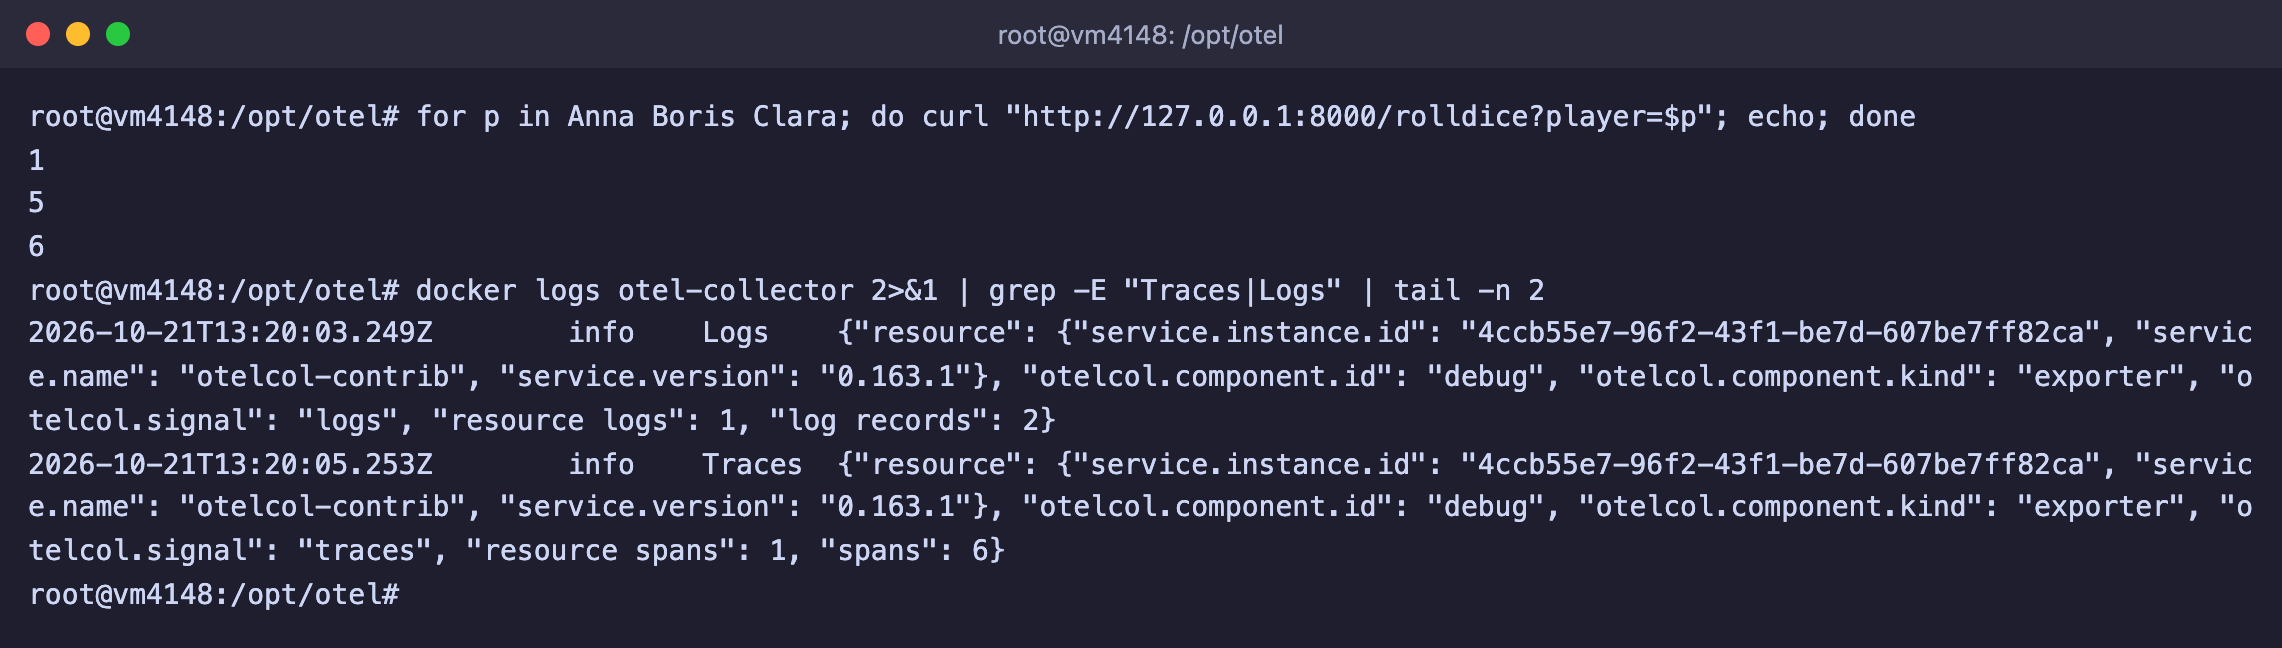
Three requests gave six spans and log records
Three requests gave six spans, that is two for each, and the application's log records. The Collector received all three signals.
Now go back to Jaeger, refresh the page, choose dice-server in the Service list and click Find Traces. Open any GET /rolldice trace and click the nested roll span.
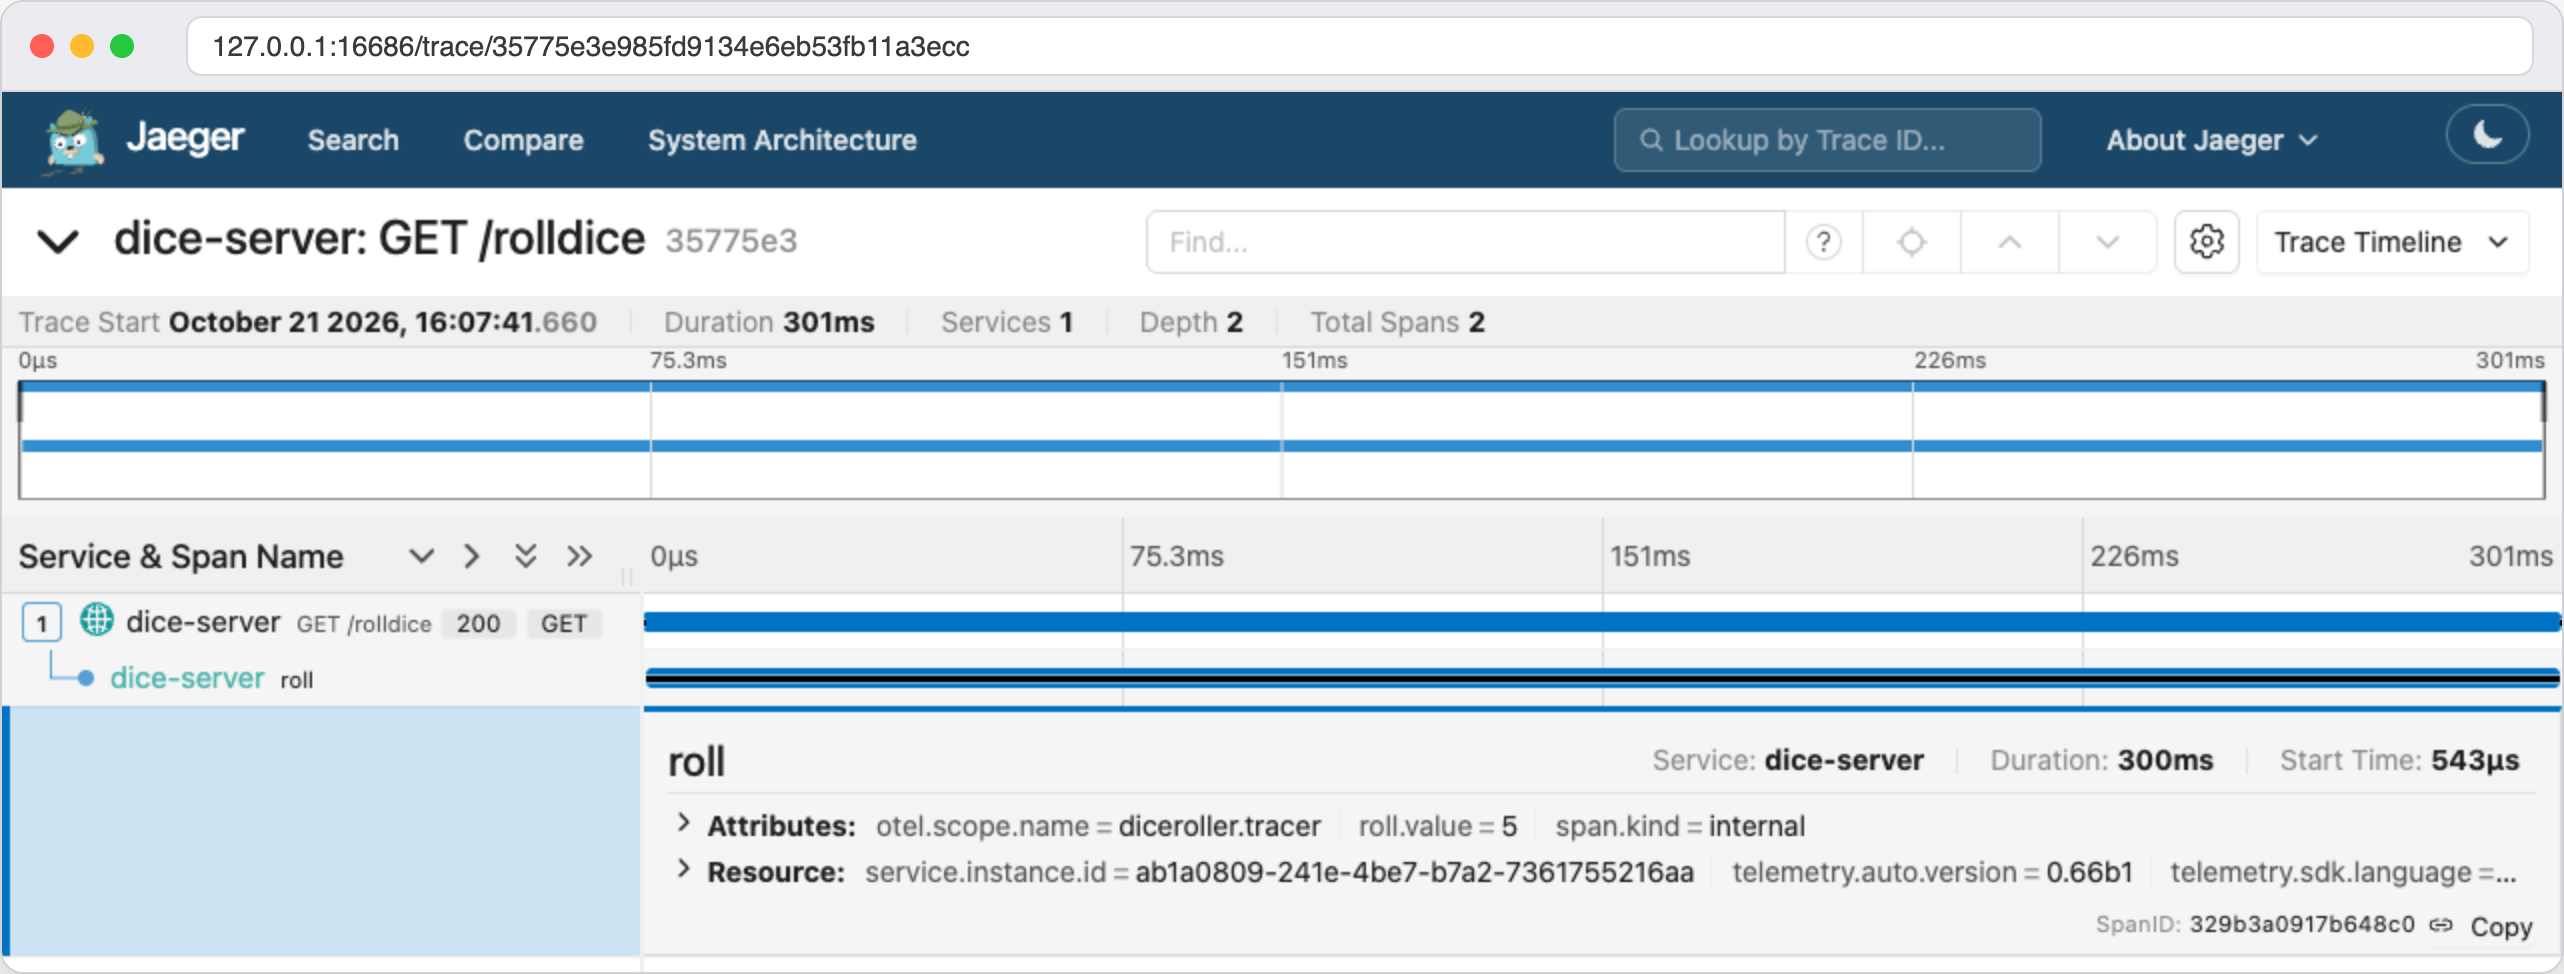
The request and the nested roll span, with its attributes at the bottom
The top bar is the whole GET /rolldice request, created by the Flask instrumentation library. Below it is the nested roll span, which we created by hand. It takes almost all the request time, about 300 of 301 milliseconds, because our pause is right there. The span attributes show roll.value with the number that came up. This way the trace immediately shows in which part of the request the time goes.
Stop the application with Ctrl + C in the first window.
Sending over HTTP instead of gRPC
The application can be switched to OTLP/HTTP with an environment variable. Add OTEL_EXPORTER_OTLP_PROTOCOL=http/protobuf before the start command, and the data will go to port 4318. If you need a different Collector address, it is set by the OTEL_EXPORTER_OTLP_ENDPOINT variable. We checked both ways, and with HTTP the service appeared in Jaeger the same way as with gRPC.
Step 7. Add server metrics
So far the Collector receives data from applications but measures nothing itself. Let's teach it to collect server metrics with the host_metrics receiver. It can take CPU load, memory, disks and network.
Go back to the project folder.
cd /opt/otelOpen the Collector settings file.
bashnano otel-config.yamlSave the changes with Ctrl + O, then Enter, and exit the editor with Ctrl + X.
Add a new receiver to the
receiverssection right afterotlp, with the same two-space indent.yaml# Metrics of the server itself host_metrics: root_path: /hostfs collection_interval: 10s scrapers: cpu: memory: load: filesystem: network:scraperslists what exactly to measure. We took CPU, memory, load average, file system and network. The receiver documentation has others as well, for example disks and processes.collection_intervalsets how often to measure. The default is one minute, and we set 10 seconds to see the result faster.root_pathis needed because the Collector runs in a container. For it to see the server rather than its own container, the server root is mounted into the/hostfsfolder, androot_pathpoints to it.
In the same file, add the new receiver to the metrics pipeline.
yamlmetrics: receivers: [otlp, host_metrics]Change the mode of the
debugexporter so that the log shows not only counters but the values themselves. In theexporterssection replace the lineverbosity: basicwithverbosity: detailedand save the file.Open the
compose.yamlfile and mount the server root read-only in thevolumessection of thecollectorservice.bashnano compose.yamlyamlvolumes: - ./otel-config.yaml:/etc/otelcol-contrib/config.yaml:ro - /:/hostfs:ro # server file system for host metricsCheck the configuration and recreate the Collector container.
bashdocker compose run --rm --no-deps collector validate --config=/etc/otelcol-contrib/config.yaml docker compose up -d
Wait about 20 seconds for the Collector to take its first measurements, and look at which metrics it collected.
docker logs otel-collector --since 12s 2>&1 | grep "Name: system" | sort -uTo make sure the numbers are real, let's take the used memory value from the log and compare it with the free command.
docker logs otel-collector --since 12s 2>&1 | grep -A12 system.memory.usage | grep -E "state|Value" | head -2
free -b | head -2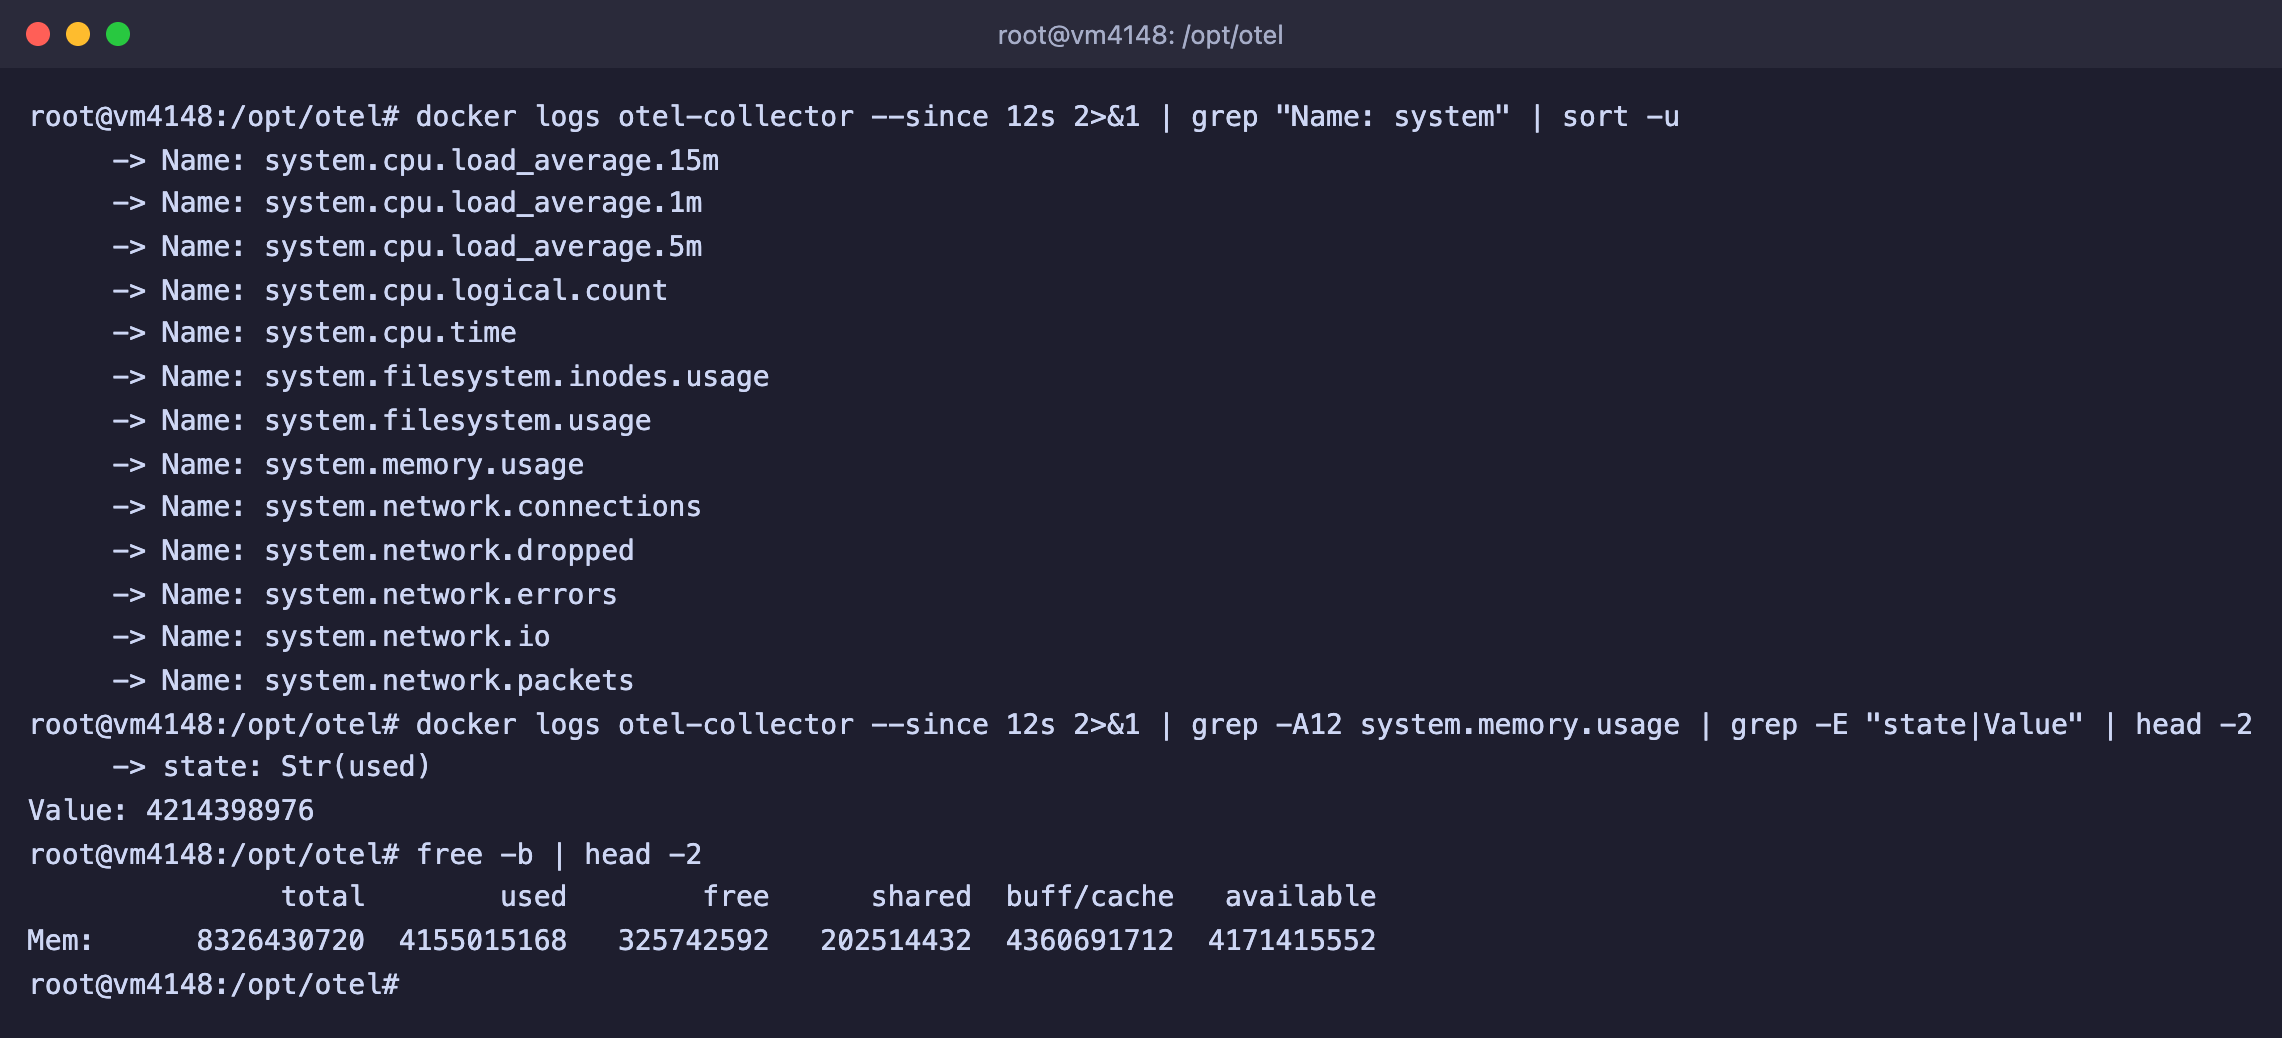
The Collector collects server metrics, and the used memory matches the free output
The Collector produced 13 metrics with names starting with system.. For example, system.cpu.load_average.1m is the load average over a minute, system.memory.usage is memory in bytes by state, system.filesystem.usage is the used space on disks, and system.network.io is the amount of data transferred. The used memory from the metric is close to the used column in the free output, and the small difference comes from the values being taken at different moments.
Put the basic mode back
The detailed mode writes about 90 KB to the log every minute, which is roughly 130 MB a day. When you have seen enough, put the verbosity: basic line back in otel-config.yaml and restart the Collector with the command docker compose restart collector.
For now the metrics go only to the log. To store them and draw charts, you need to send them to a metrics storage, and the Collector has exporters for that, for example prometheus. That is a topic for a separate article.
Useful commands
docker compose ps                        # container status and ports
docker compose logs -f collector         # Collector log in real time
docker compose restart collector         # re-read the settings file
docker compose run --rm --no-deps collector validate --config=/etc/otelcol-contrib/config.yaml   # check the settings
docker compose down                      # stop and remove the containers
After stopping with docker compose down, the traces in Jaeger disappear, because they are stored only in memory.
Frequently asked questions
Do I need to open ports 4317, 4318 and 16686 in UFW
No. Applications on the same server connect to 127.0.0.1, and we open Jaeger through an SSH tunnel. In Compose the ports are published only on 127.0.0.1, and we checked from another computer that connections to them on the server's external address are not established. Do not replace 127.0.0.1:4317:4317 with 4317:4317 unless you have to. The UFW firewall does not close Docker ports, and a Collector without passwords would be open to the whole internet.
The application works, but there is nothing in the Collector and Jaeger, and the log says Failed to auto initialize OpenTelemetry
The OTLP exporter is not installed. We ran the application with opentelemetry-distro alone and got these lines.
RuntimeError: Requested component 'otlp_proto_grpc' not found in entry point 'opentelemetry_traces_exporter'
Failed to auto initialize OpenTelemetry
The application itself keeps answering requests, so the error easily goes unnoticed. Stop the application, run pip install opentelemetry-exporter-otlp and start it again.
Jaeger is empty, and there is not a single error in the application terminal
Sending errors are not printed to the terminal, because log records, including messages from OpenTelemetry itself, are collected by the automatic instrumentation. We checked that with the --logs_exporter console parameter the same records together with export errors appear on the screen. Start the application like this.
opentelemetry-instrument --service_name dice-server --logs_exporter console flask run -p 8000The console will start showing both the application's own records and export error messages, examples of which are covered in the next two questions.
Failed to export traces to localhost:4318 … Trying to connect an http1.x server
The application sends data over gRPC, but the address points to the HTTP port. We reproduced the error by starting the application with the Collector address http://localhost:4318 through the OTEL_EXPORTER_OTLP_ENDPOINT variable.
Failed to export traces to localhost:4318, error code: StatusCode.UNAVAILABLE, error details: failed to connect to all addresses; last error: INTERNAL: ipv4:127.0.0.1:4318: Failed parsing HTTP/2 (Expected SETTINGS frame as the first frame, got frame type 80) (Trying to connect an http1.x server (HTTP status 400))There are two ways out. Either put back the gRPC port 4317, or switch the application to HTTP with the variable OTEL_EXPORTER_OTLP_PROTOCOL=http/protobuf. With the telemetrygen tool the same error looks like http2: frame too large, note that the frame header looked like an HTTP/1.1 header.
BadStatusLine … encountered while exporting spans batch, malformed HTTP response
This is the reverse situation. The application or the tool sends data over HTTP, but the address points to the gRPC port. We started the application with the variables OTEL_EXPORTER_OTLP_PROTOCOL=http/protobuf and OTEL_EXPORTER_OTLP_ENDPOINT=http://localhost:4317.
Transient error ('Connection aborted.', BadStatusLine('\x00\x00\x06\x04\x00\x00\x00\x00\x00\x00\x05\x00\x00@\x00')) encountered while exporting spans batch, retrying in 0.82s.
Failed to export spans batch due to timeout, max retries or shutdown.
Remember the correspondence. Port 4317 accepts only gRPC, and port 4318 accepts only HTTP. For HTTP, do not forget --otlp-http for telemetrygen as well.
transport: Error while dialing … connect: connection refused
The Collector is not running or the address is wrong. We got this error by sending traces to port 4319, where nothing is listening.
traces export: exporter export timeout: rpc error: code = Unavailable desc = connection error: desc = "transport: Error while dialing: dial tcp 127.0.0.1:4319: connect: connection refused"Check that the container is running with the docker compose ps command, and that the ports are being listened on the server.
ss -tln | grep -E ":(4317|4318|16686) "The output should contain three lines with the 127.0.0.1 address.
tls: first record does not look like a TLS handshake
By default the telemetrygen tool connects over TLS, while our Collector accepts data without encryption. We got this error by running the tool without the --otlp-insecure parameter.
transport: authentication handshake failed: tls: first record does not look like a TLS handshakeAdd the --otlp-insecure parameter.
error reading server preface: connection reset by peer
The port is published, but the Collector inside the container is listening on the wrong address. This happens if the otlp receiver has no endpoint set. We checked the configuration with empty grpc: and http:, and these addresses appeared in the Collector log.
"endpoint": "127.0.0.1:4317"
"endpoint": "127.0.0.1:4318"
Telemetrygen then responds with an error.
traces export: exporter export timeout: rpc error: code = Unavailable desc = connection error: desc = "error reading server preface: connection reset by peer"Set endpoint: 0.0.0.0:4317 for gRPC and endpoint: 0.0.0.0:4318 for HTTP in the configuration, as in step 2, and restart the Collector.
references exporter "jaeger" which is not configured
The pipeline names a component that is not in its own configuration section. We got this error by writing jaeger in the traces pipeline instead of otlp_grpc/jaeger.
Error: service::pipelines::traces: references exporter "jaeger" which is not configuredThe name in the service section must match the name in exporters, including the part after the slash. The Collector complains in the same way about receivers and processors that are not described.
receivers::host_metrics: invalid root_path: stat /hostfs: no such file or directory
The server root is not mounted into the /hostfs folder in compose.yaml, while the folder is given in the settings of the host_metrics receiver.
Error: receivers::host_metrics: invalid root_path: stat /hostfs: no such file or directoryAdd the line - /:/hostfs:ro to the volumes section, as in step 7.
Our resources
Telegram channel: https://t.me/f3cloud_news
F3 Cloud: https://f3cloud.com