> The full list of articles is in [llms.txt](https://docs.f3cloud.com/llms.txt). Every page has a Markdown version: add .md to its address. This page as Markdown: [https://docs.f3cloud.com/en/docker/uptime-kuma.md](https://docs.f3cloud.com/en/docker/uptime-kuma.md).

# Uptime Kuma – monitoring websites and servers on a VPS

How to install Uptime Kuma on a VPS and keep an eye on your websites and servers. Installation in Docker, an SSH tunnel to the dashboard, creating an administrator, HTTP, TCP and ping monitors, retries, a public status page, notifications (using Telegram and Webhook as examples), backups and updating. Tested on Debian 12 with Uptime Kuma 2.5.6.

**Uptime Kuma** is a free open-source program that keeps an eye on whether your websites and servers are working. Every minute it visits the site, tries to open the port, pings the address, and if something stops responding, you find out right away and not from your clients. Besides the checks, Kuma draws availability charts, keeps the history of outages and can publish a status page where visitors see whether everything is fine. In this article we will install Uptime Kuma on a VPS in Docker, create an administrator, add monitors of different types, deliberately cause an outage, publish a status page and go through notifications, backups and updating. We repeated all the steps on a test server with Debian 12, and the Uptime Kuma version at the time of testing was **2.5.6**.

***

## How Uptime Kuma works

Uptime Kuma is a single Node.js program with a web interface. On the server it runs as an ordinary process that performs checks on a schedule, and every check is very simple. For a website it is an HTTP request, for a port it is an attempt to establish a TCP connection, and for ping it is an ordinary echo request. A check has only two outcomes, a response was received or it was not, and the response time is added to them. Kuma writes every result to the database as a separate point, and those points make up the coloured bars on the dashboard, the availability percentages and the response time chart. Consecutive failed points form an outage, and its start and end go into the event log.

Two practical conclusions follow from this design. The first is that Kuma sees your service the way the server it is installed on sees it, not the way your clients see it. If Kuma runs on the same server as the website, the monitoring itself goes silent when the server goes down, so for real projects it is better to install it on a separate inexpensive VPS. In our test, for demonstration purposes, we watched both the server itself and a website from a container. The second conclusion concerns Docker. A container lives in its own network, and the address `127.0.0.1` inside it means the container itself, not the server. So Kuma has to check the server's ports under a special name that we will add to the settings in Step 1. We ran into this ourselves while checking the SSH port, and you can find the details in the FAQ at the end of the article.

A single failed check does not always mean a real outage, because a website could fail to respond due to a random network glitch. That is what the **Retries** setting is for, and every monitor has it. While retries remain, Kuma draws the failed check as an orange bar and sends nothing, and only if there is still no response after all the repeats does it mark the service as down and send notifications. In Uptime Kuma 2 new monitors have 0 retries, which means an outage is declared right after the first failed check. We will show the difference in Step 6. All of Kuma's data, from the account to the check history, lies in a single `data` folder on the server, and by default the check history is kept for 180 days. Thanks to this the program is easy to update and copy.

> **Why the image tag is 2.**
>
> The developers recommend the image with the `2` tag, which always points to the latest release of the second branch. The old `latest` tag is marked as deprecated in their documentation and still points to the first version, so it is better not to use it.

***

## What you need

* **A server** with Debian 12, for example the **DE-RZ9-1** plan. The Uptime Kuma container with five monitors took about 150 MB of memory on our server, and the downloaded image took about 2.5 GB of disk space, so it is better not to install it on the smallest disk. If you do not have a server yet, order one using the [guide](https://docs.f3cloud.com/en/client-area/order-vps.md).
* **Docker and Docker Compose**. If you do not have them yet, install them using the [guide](https://docs.f3cloud.com/en/docker/docker-installation.md). We had Docker 29.9.2 and Docker Compose 5.6.1.
* **An SSH connection**, for example via [Termius](https://docs.f3cloud.com/en/vps/termius-connection.md). Commands are run as `root`.
* **The address of the website** you want to watch. In the examples we use `https://example.com`.

***

## Step 1. Install Uptime Kuma

Create a folder for Kuma and a Docker Compose settings file.

```bash
mkdir -p /opt/kuma
cd /opt/kuma
nano compose.yaml
```

Paste the settings below into the file and save it with <kbd>Ctrl</kbd> + <kbd>O</kbd>, then <kbd>Enter</kbd>, and exit the editor with <kbd>Ctrl</kbd> + <kbd>X</kbd>.

```yaml
services:
  uptime-kuma:
    image: louislam/uptime-kuma:2   # official image, second version
    container_name: uptime-kuma
    restart: unless-stopped         # start after a failure and a server reboot
    volumes:
      - ./data:/app/data            # all Kuma data lies in the /opt/kuma/data folder
    ports:
      - "127.0.0.1:3001:3001"       # port 3001 is open only on the server itself
    extra_hosts:
      - "host.docker.internal:host-gateway"   # the server's name for checks from inside the container
```

The file almost repeats the official `compose.yaml` from the Uptime Kuma repository, and we added three things to it.

* `container_name` sets a clear container name that we will use in the commands.
* `127.0.0.1:` before the port leaves the dashboard available only from the server itself. The official file has `3001:3001`, and then the port is open to everyone.
* `extra_hosts` adds the name `host.docker.internal` inside the container, which points to the server. You will need it in Step 5 to check the server's ports.

Start Kuma.

```bash
docker compose up -d
```

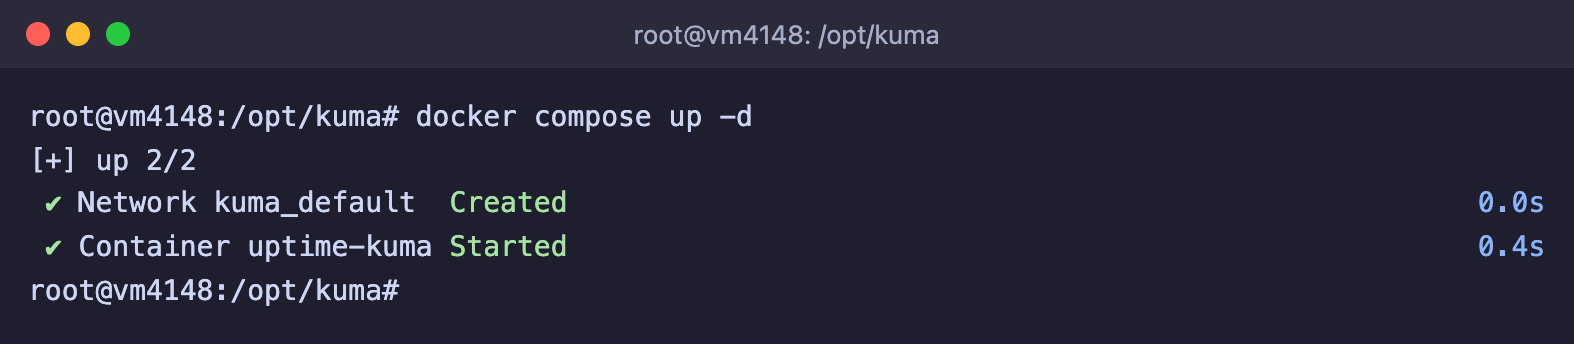
On the first start Docker will download an image of about 600 MB, which took about 20 seconds on our server. Then Docker will create a network and start the container.

<figure><img src="https://docs.f3cloud.com/img/kuma-install.png" alt="The docker compose up -d command creates the kuma_default network and starts the uptime-kuma container"><figcaption><p>Docker created the network and started the Uptime Kuma container</p></figcaption></figure>

Check the state with the `docker compose ps` command. In about 20 seconds the **STATUS** column will show the `(healthy)` mark, which means Kuma has started and is responding.

> **Do not open port 3001 to the internet.**
>
> The Kuma dashboard sends the administrator's password in clear text over plain HTTP, so we left the port only on `127.0.0.1`. In addition, Docker publishes ports bypassing the UFW firewall, and this trap is described in more detail in the article about [Docker](https://docs.f3cloud.com/en/docker/docker-installation.md). We checked this on the test server. When we removed `127.0.0.1` from the `ports` line, port 3001 became reachable from our computer even though UFW had no rule for it. With `127.0.0.1` the connection was not established, and the computer simply waited until the timeout.

***

## Step 2. Open the dashboard through an SSH tunnel

Since the port is closed from the internet, the dashboard is opened through an SSH tunnel. It forwards a port of your computer to a port of the server, so to the browser Kuma looks as if it were running on your computer.

1. On your computer, open a new terminal window and create the tunnel. Instead of `server-IP`, put the address of your VPS.

   ```bash
   ssh -L 3001:127.0.0.1:3001 root@server-IP
   ```

2. Without closing this window, open `http://localhost:3001` in your browser.

If port 3001 on your computer is already taken, forward a different one, for example `ssh -L 13001:127.0.0.1:3001 root@server-IP`, and open `http://localhost:13001`. This is exactly how we worked ourselves.

***

## Step 3. Choose a database and create an administrator

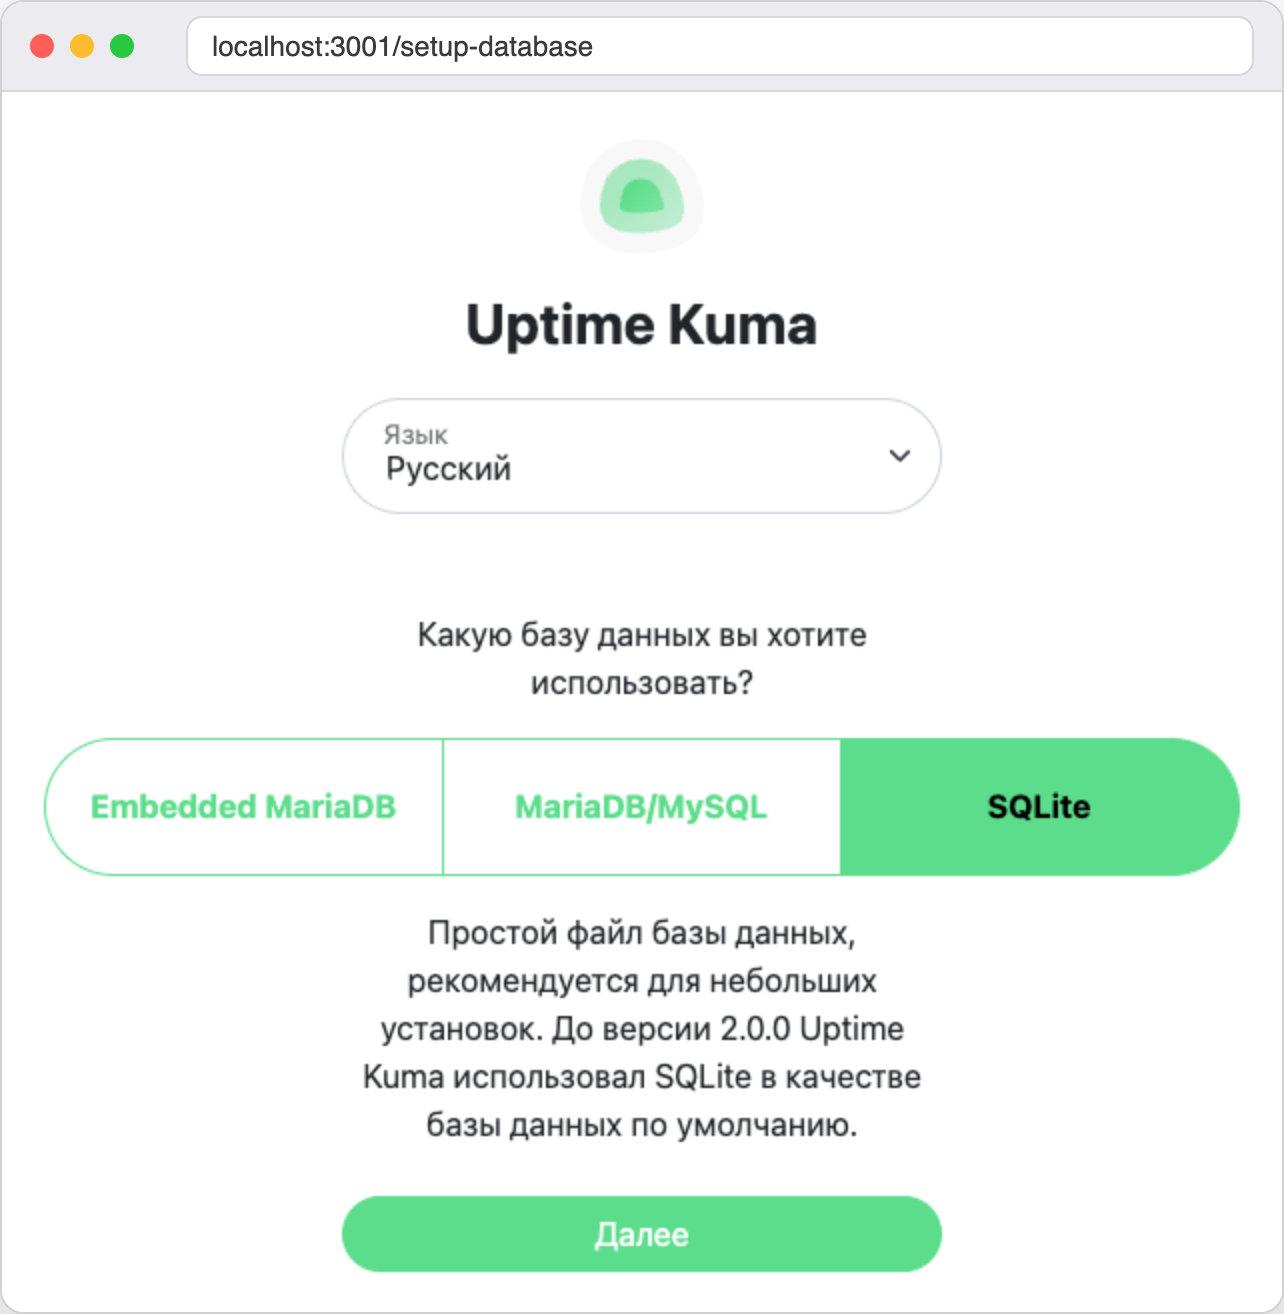
On the first launch Kuma 2 asks **Which database would you like to use?** The interface opened in Russian for us right away because our browser was set to Russian, and you can change the language in the **Language** list on the same page. There are three options.

* **Embedded MariaDB** – nothing needs to be configured, the Docker image already contains a ready MariaDB.
* **MariaDB/MySQL** – a connection to an external database. You need to specify the host name, port, username, password and database name.
* **SQLite** – a simple database file, recommended for small installations.

Select **SQLite** and click <kbd>Next</kbd>. This is the simplest option, Kuma itself recommends it for small installations, and the whole database will be a single file in the `data` folder, which makes backups easier.

<figure><img src="https://docs.f3cloud.com/img/kuma-setup-db.png" alt="First launch of Uptime Kuma 2, database selection, the SQLite option is selected"><figcaption><p>Choosing a database on the first launch</p></figcaption></figure>

After a few seconds Kuma will prepare the database and offer to **Create your admin account**.

1. In the **Username** field, enter the administrator's name, for example `admin`.
2. In the **Password** and **Repeat Password** fields, enter a long password. It is better to generate it in a password manager.
3. Click <kbd>Create</kbd>.

<figure><img src="https://docs.f3cloud.com/img/kuma-setup-admin.png" alt="The Uptime Kuma administrator creation form with the Username, Password and Repeat Password fields"><figcaption><p>The administrator account</p></figcaption></figure>

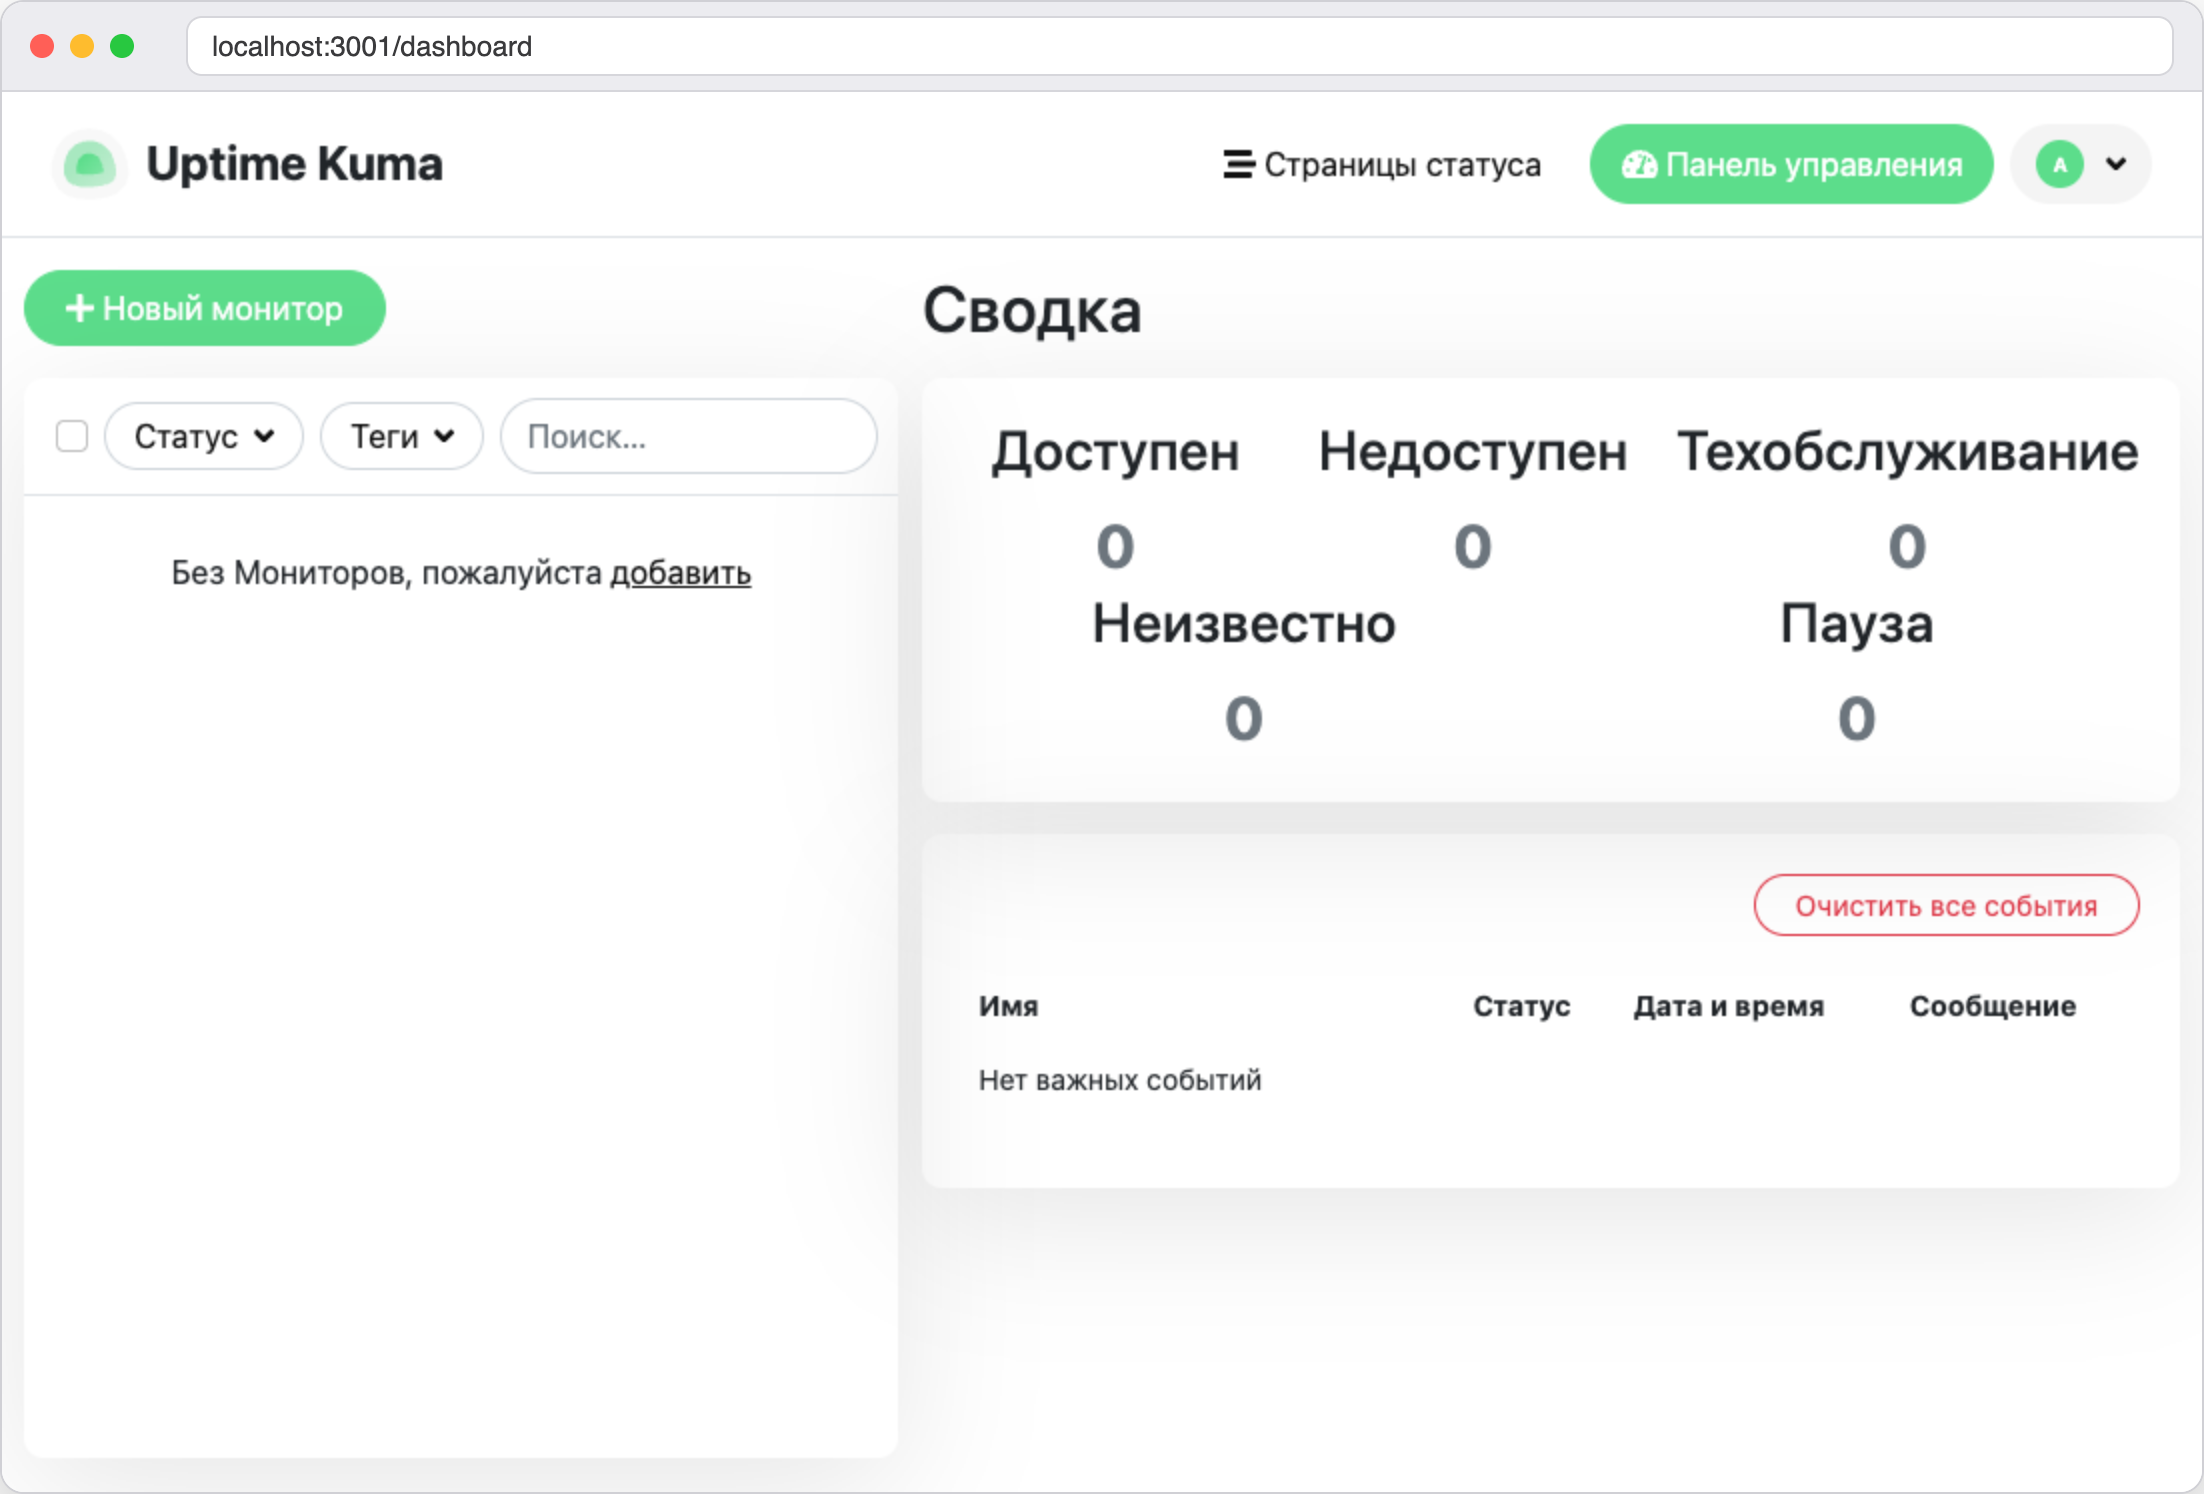
Kuma will open the dashboard. On the left there will be the list of monitors, still empty, and on the right **Quick Stats**, which counts monitors by state, and the log of important events.

<figure><img src="https://docs.f3cloud.com/img/kuma-dashboard-empty.png" alt="The empty Uptime Kuma dashboard with the message No Monitors, please add one"><figcaption><p>The dashboard before any monitors are added</p></figcaption></figure>

***

## Step 4. Add the first monitor for a website

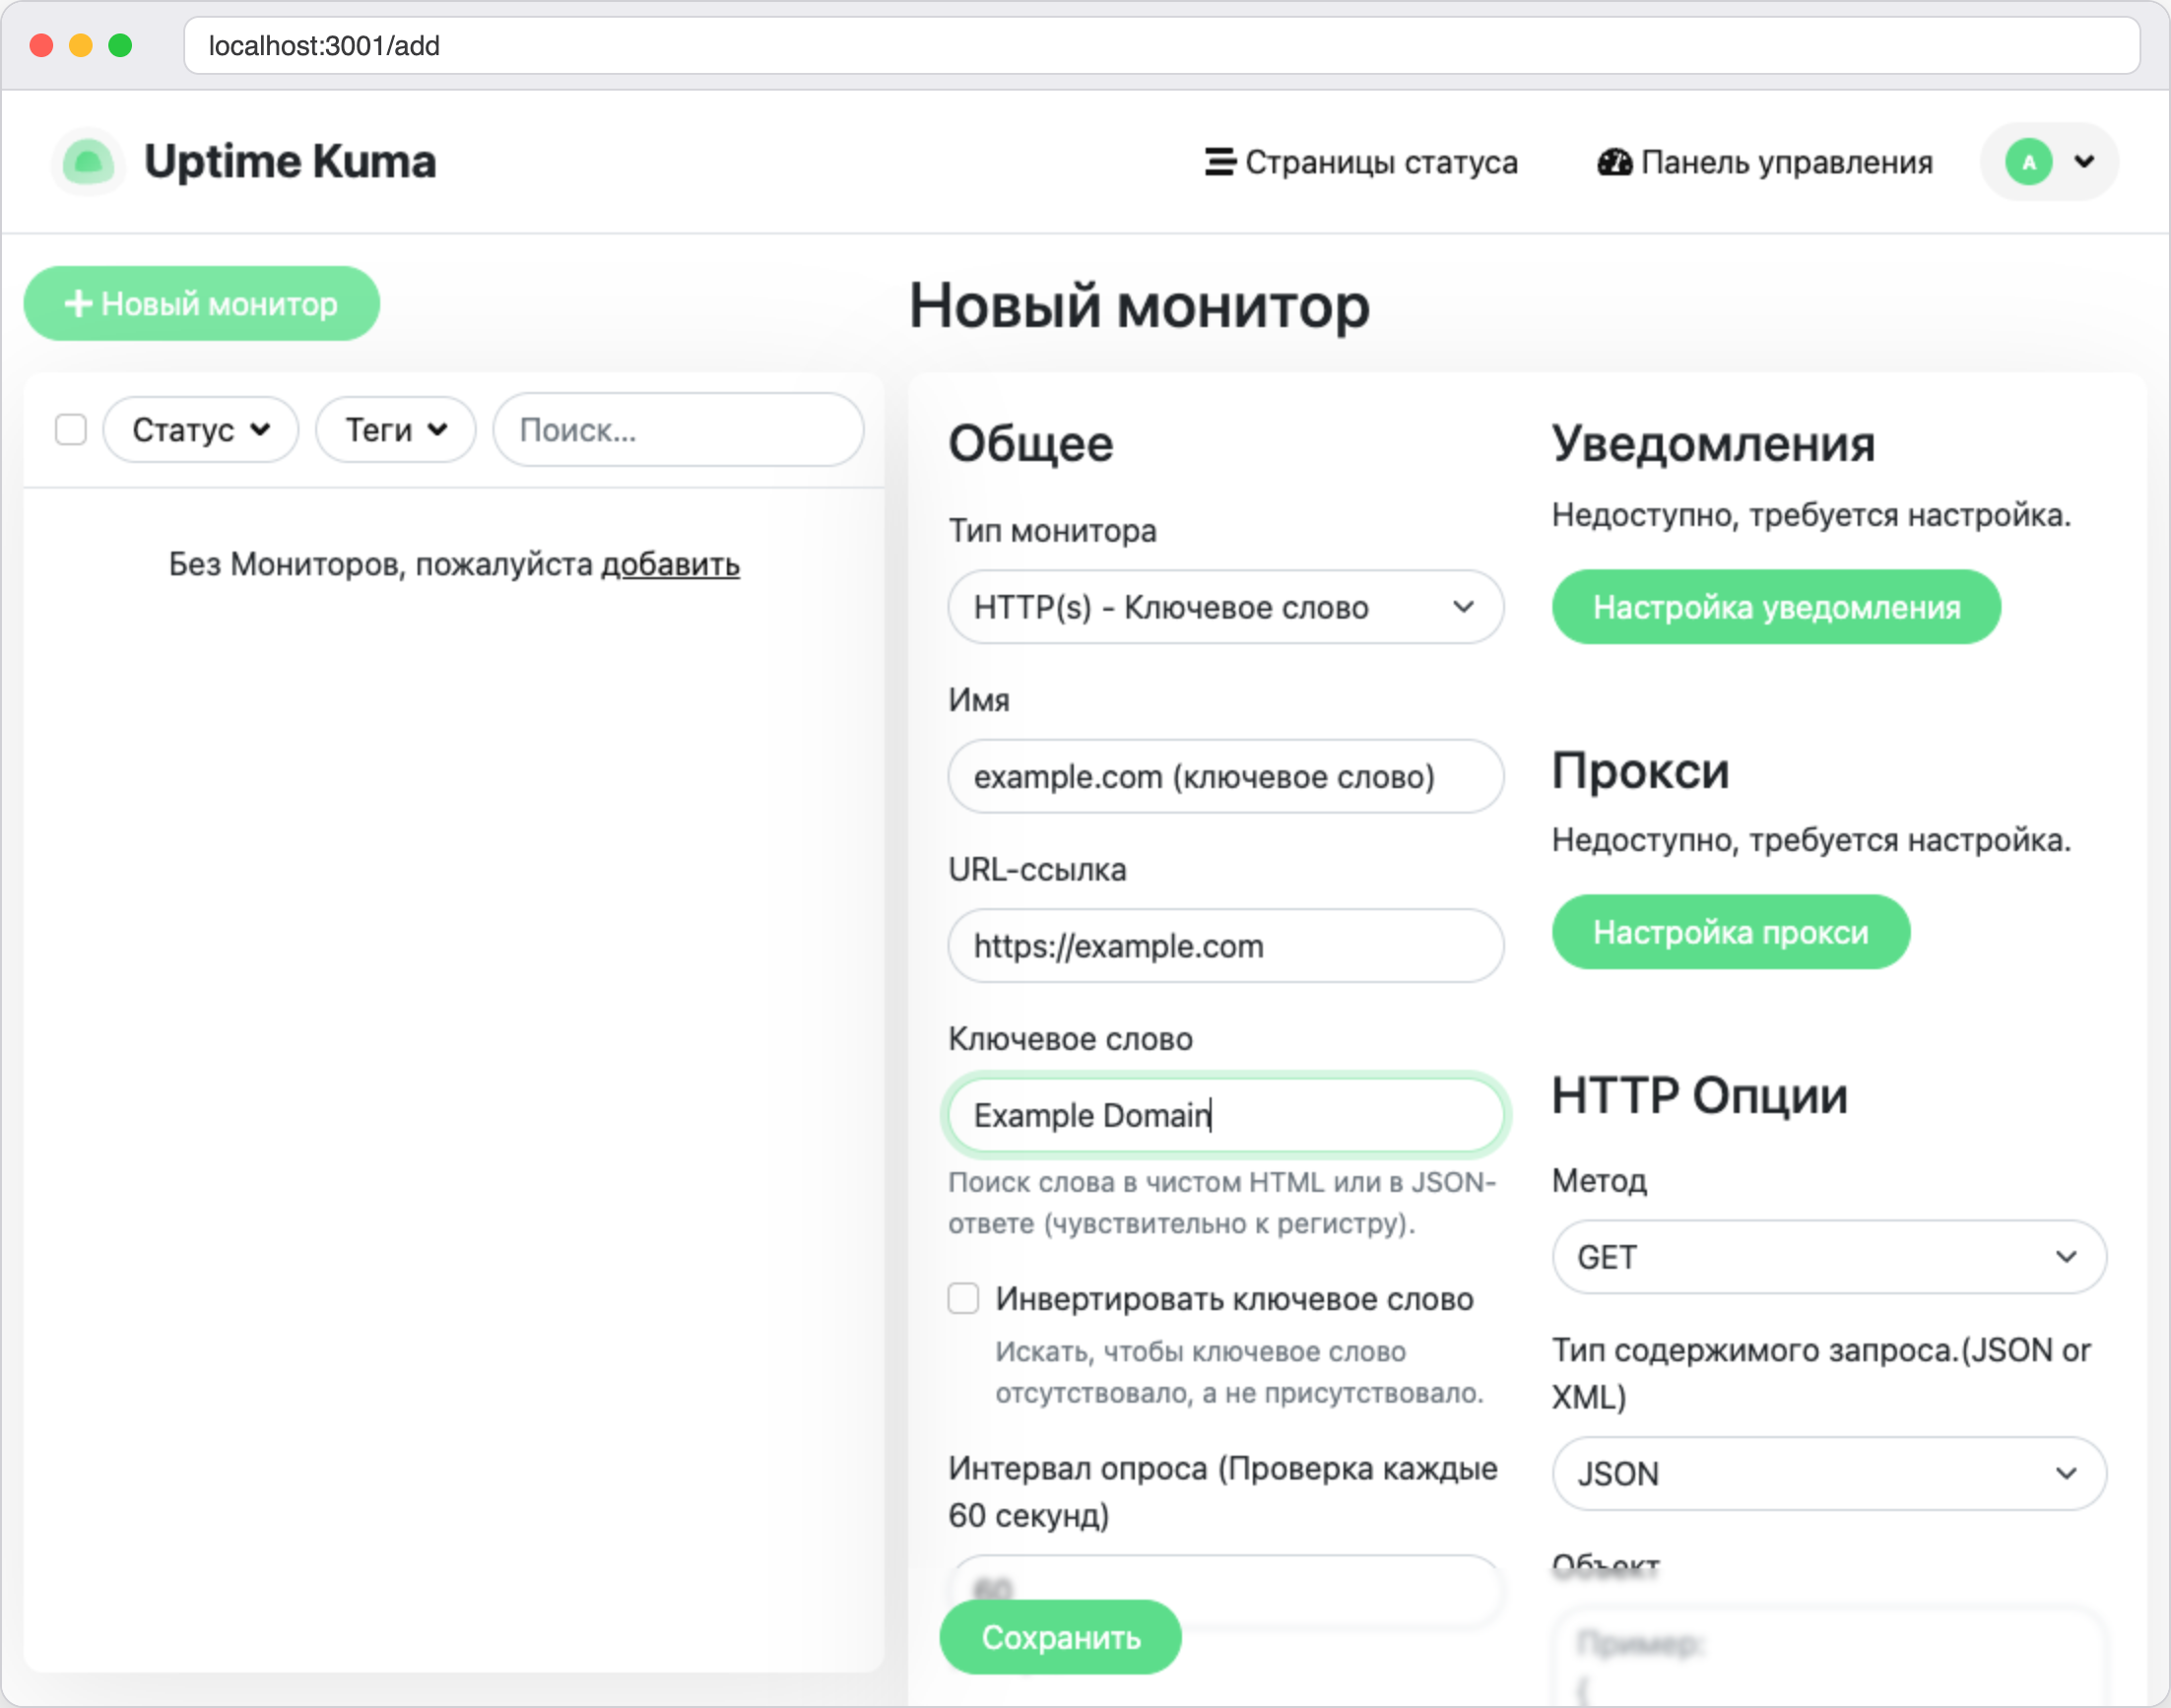
For a website, the best choice is a monitor that checks not only the response code but also the content of the page. A broken website often keeps answering with code 200 but shows an empty space or an error message instead of the page. A keyword monitor will notice this too.

1. Click <kbd>Add New Monitor</kbd>.
2. In the **Monitor Type** list, choose **HTTP(s) - Keyword**.
3. In the **Friendly Name** field, enter a name, for example `example.com (keyword)`.
4. In the **URL** field, enter the website address, in our case `https://example.com`.
5. In the **Keyword** field, enter a word that must be on the page. For example.com it is `Example Domain`. The letter case matters.
6. Click <kbd>Save</kbd>.

<figure><img src="https://docs.f3cloud.com/img/kuma-add-monitor.png" alt="The new monitor form, type HTTP(s) - Keyword, address https://example.com, the word Example Domain"><figcaption><p>A keyword monitor</p></figcaption></figure>

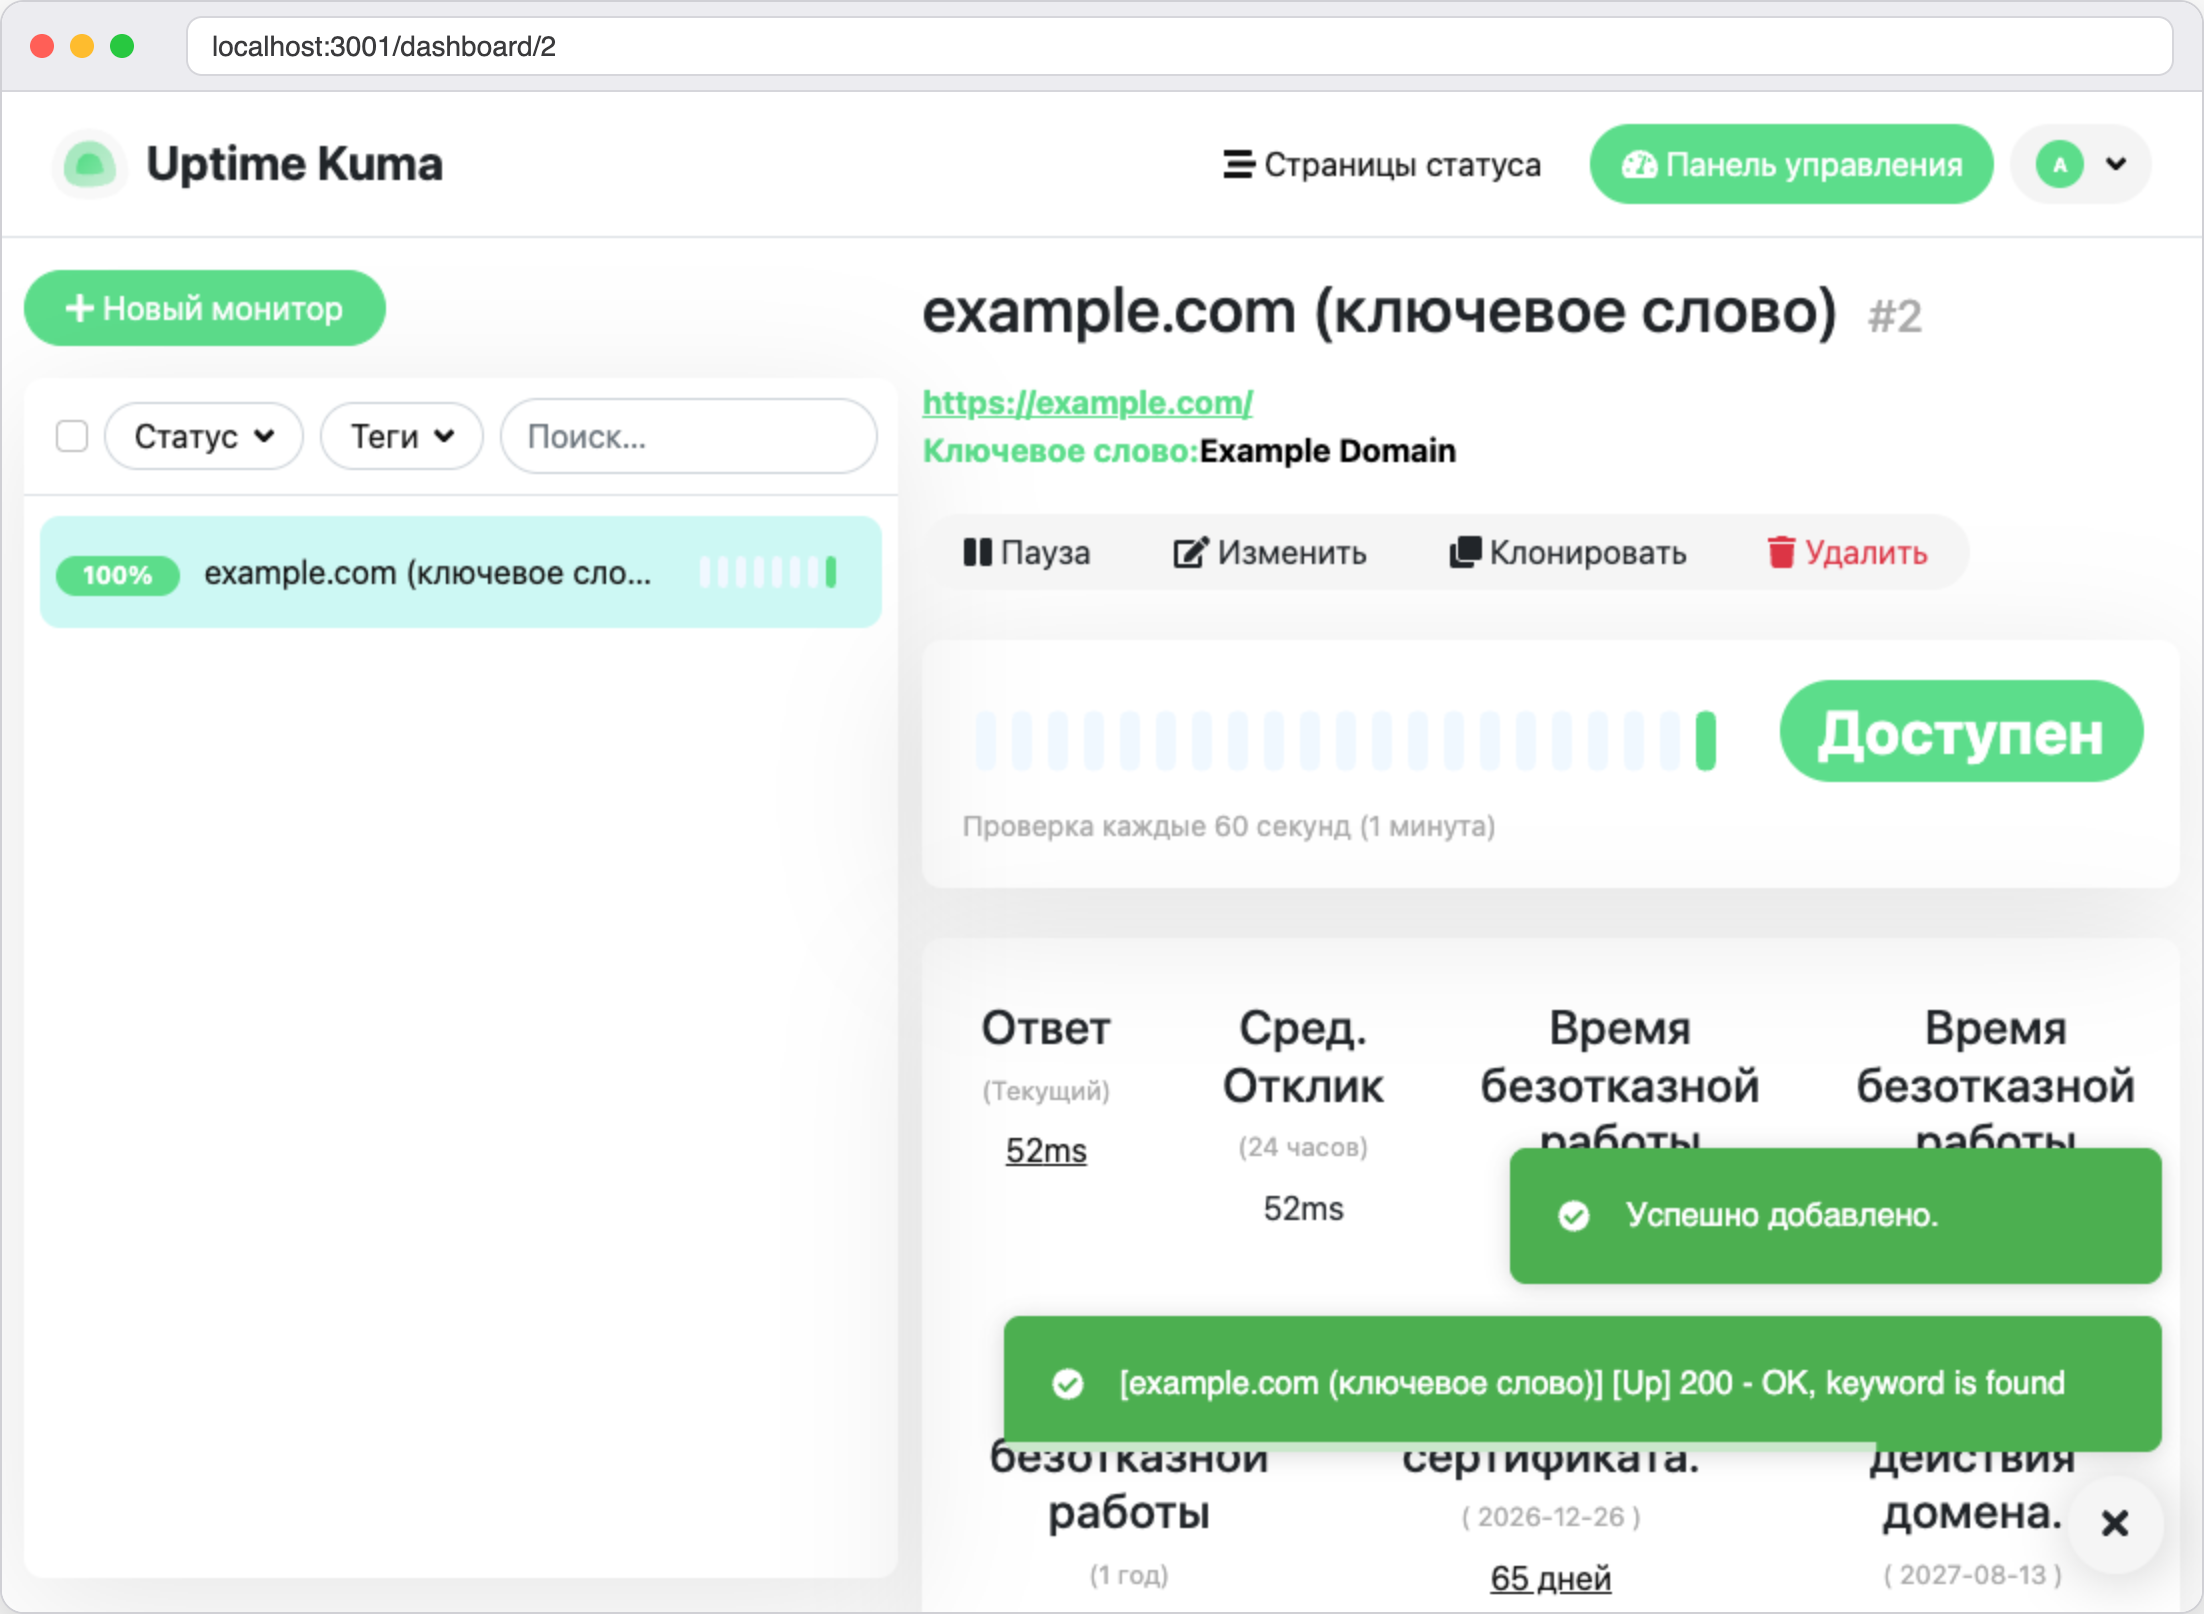
After a few seconds Kuma will make the first check, and the monitor will turn green with the **Up** status. Our website responded in 52 ms, and an entry `200 - OK, keyword is found` appeared in the log. For an HTTPS website, Kuma shows on the same page how many days are left until the certificate and the domain name expire.

<figure><img src="https://docs.f3cloud.com/img/kuma-first-monitor.png" alt="The example.com monitor page with the Up status, a response time of 52 ms and the certificate and domain expiry dates"><figcaption><p>The first check passed, the monitor is green</p></figcaption></figure>

The form has settings that are worth knowing from the very beginning.

* **Heartbeat Interval** – how often Kuma checks the website, 60 seconds by default.
* **Retries** – how many times to repeat a failed check before declaring an outage. 0 by default.
* **Request Timeout** – how many seconds to wait for a response, 48 by default.
* **Certificate Expiry Notification** – a warning when the website's certificate is about to expire.

***

## Step 5. Add monitors for the server

Now let's check the server itself. First we will add an SSH port monitor, which will show that the server is on and accepts connections.

1. Click <kbd>Add New Monitor</kbd> and choose the **TCP Port** type.
2. In the **Friendly Name** field, enter `Server SSH`.
3. In the **Hostname** field, enter `host.docker.internal`.
4. In the **Port** field, enter `22`.
5. Click <kbd>Save</kbd>.

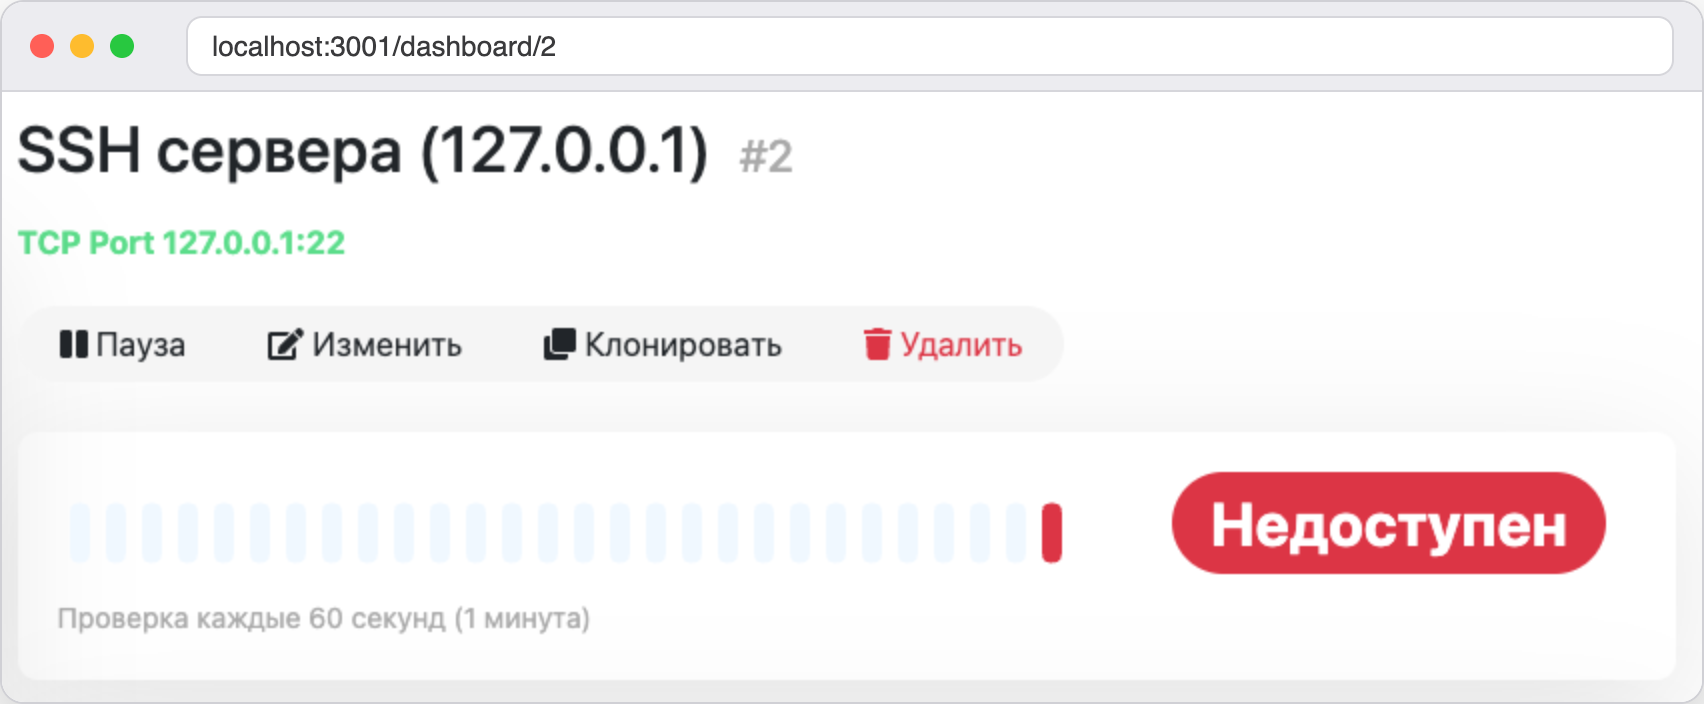
Pay attention to the host name. The address `127.0.0.1`, which seems the obvious choice, will not work inside the container, because it leads to the container itself, where there is no port 22. We checked this ourselves, and the monitor for `127.0.0.1:22` turned red right away.

<figure><img src="https://docs.f3cloud.com/img/kuma-localhost-down.png" alt="The Server SSH monitor for 127.0.0.1:22 in Uptime Kuma has the Down status"><figcaption><p>This is what a monitor that looks at 127.0.0.1 inside the container looks like</p></figcaption></figure>

After we replaced the host name with `host.docker.internal`, the monitor turned green and the port responded in 1 ms. The name works because we added `extra_hosts` to the Compose file in Step 1. In our test it pointed to the address `172.17.0.1`, which is the server's address inside the Docker network.

Now let's add a ping monitor, which checks whether an address responds to echo requests.

1. Click <kbd>Add New Monitor</kbd> and choose the **Ping** type.
2. In the **Friendly Name** field, enter `Ping 1.1.1.1`.
3. In the **Hostname** field, enter `1.1.1.1`.
4. Click <kbd>Save</kbd>.

Ping to `1.1.1.1` responded in 6.45 ms. It is useful for making sure the server has internet access, or for watching a router and other devices that have no website.

The list of types has other monitors too. Among them are **DNS**, **SMTP**, **Docker Container**, **Push**, as well as the database checks **MySQL/MariaDB**, **PostgreSQL**, **MongoDB** and **Redis**. The principle is the same for all of them, Kuma contacts the service on a schedule and records the result.

***

## Step 6. Cause an outage and see what it looks like

Monitors exist for those minutes when something breaks, so let's check what that looks like. We will start with the simplest outage, a port that nobody is listening on.

1. Click <kbd>Add New Monitor</kbd> and choose the **TCP Port** type.
2. In the **Friendly Name** field, enter `Closed port 12345`.
3. In the **Hostname** and **Port** fields, enter `host.docker.internal` and `12345`.
4. In the **Heartbeat Interval** field, enter `20` so you do not have to wait a minute.
5. Click <kbd>Save</kbd>.

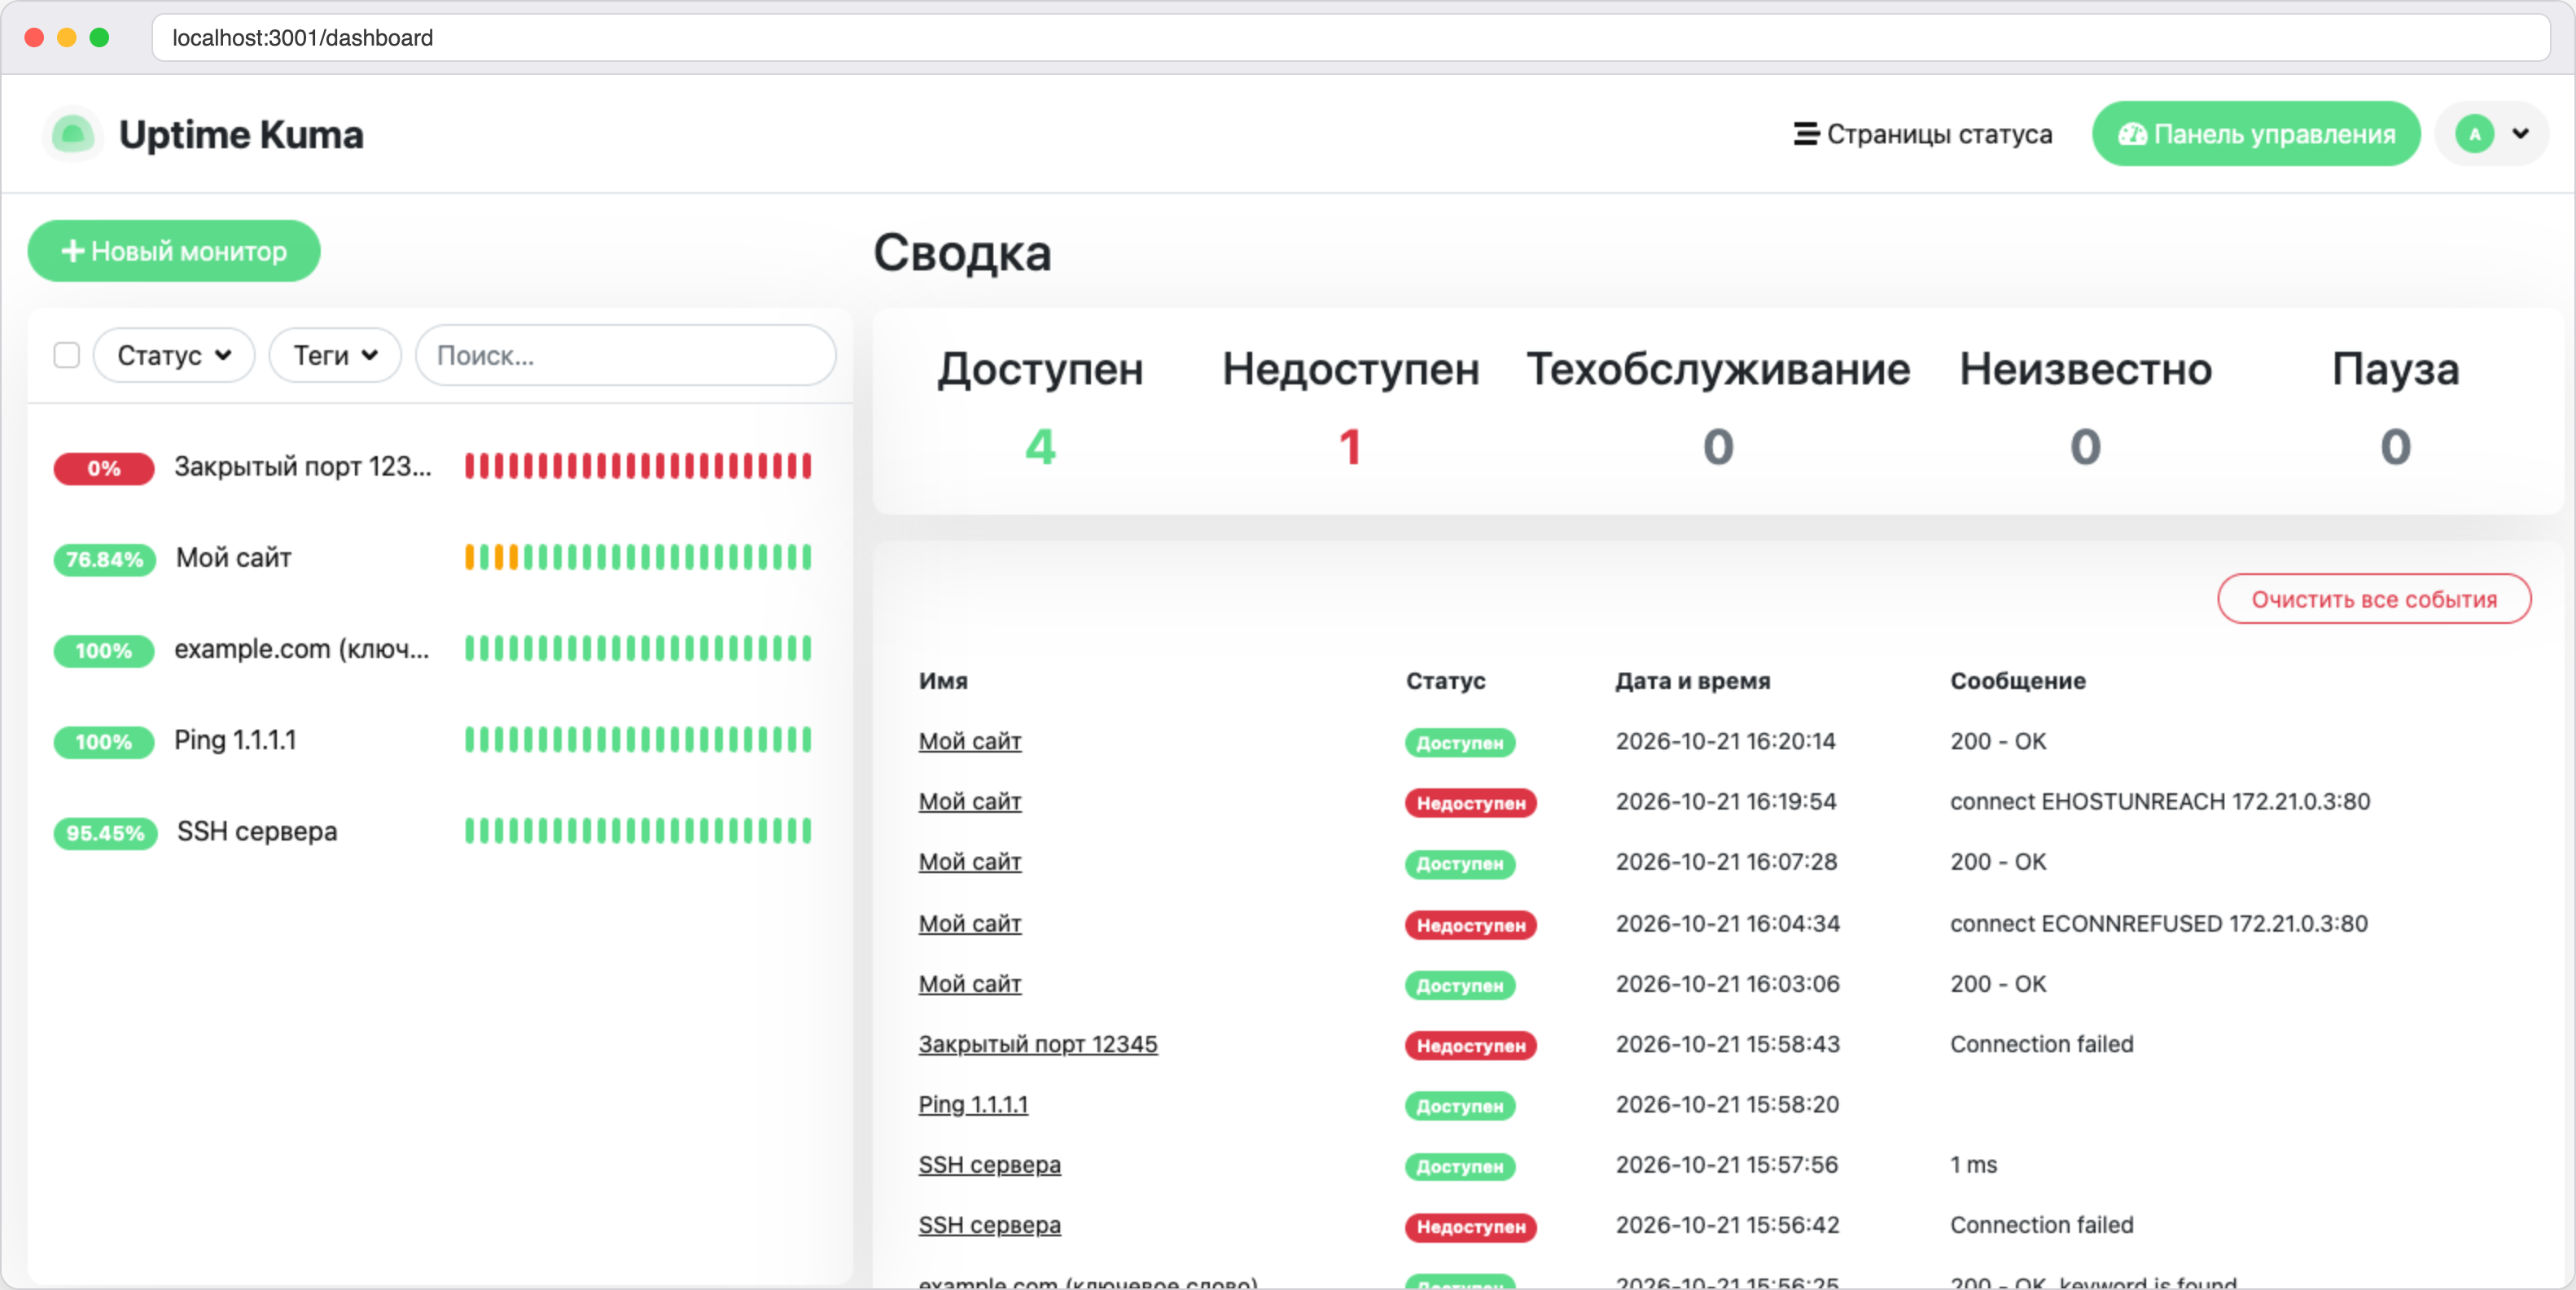
After a few seconds the monitor will turn red, and a red message will appear in the corner of the screen. The event log will record the **Down** status with the text `Connection failed`, and in the quick stats the **Down** counter will change to 1. Such a monitor will never turn green, and we will leave it on the dashboard as an example of an outage.

<figure><img src="https://docs.f3cloud.com/img/kuma-dashboard.png" alt="The Uptime Kuma dashboard, four monitors are up, one is down, the event log with outages and recoveries is below"><figcaption><p>Quick stats and the event log. The closed port monitor is highlighted in red</p></figcaption></figure>

Now let's cause a more lifelike outage. We will start a simple website in Docker on the server and stop it. The container has to be placed in the same network as Kuma. Docker Compose created it by itself, and the network name is made of the folder name and the word `default`, in our case `kuma_default`.

```bash
docker run -d --name kuma-demo-site --network kuma_default --restart unless-stopped nginx:alpine
```

Add a monitor for this website.

1. Click <kbd>Add New Monitor</kbd> and choose the **HTTP(s)** type.
2. In the **Friendly Name** field, enter `My site`.
3. In the **URL** field, enter `http://kuma-demo-site`. Containers in the same network find each other by name.
4. In the **Heartbeat Interval** field, enter `20`.
5. In the **Retries** field, enter `2`. The **Heartbeat Retry Interval** field will appear next to it, leave `20` in it.
6. Click <kbd>Save</kbd>.

Stop the website and wait about a minute.

```bash
docker stop kuma-demo-site
```

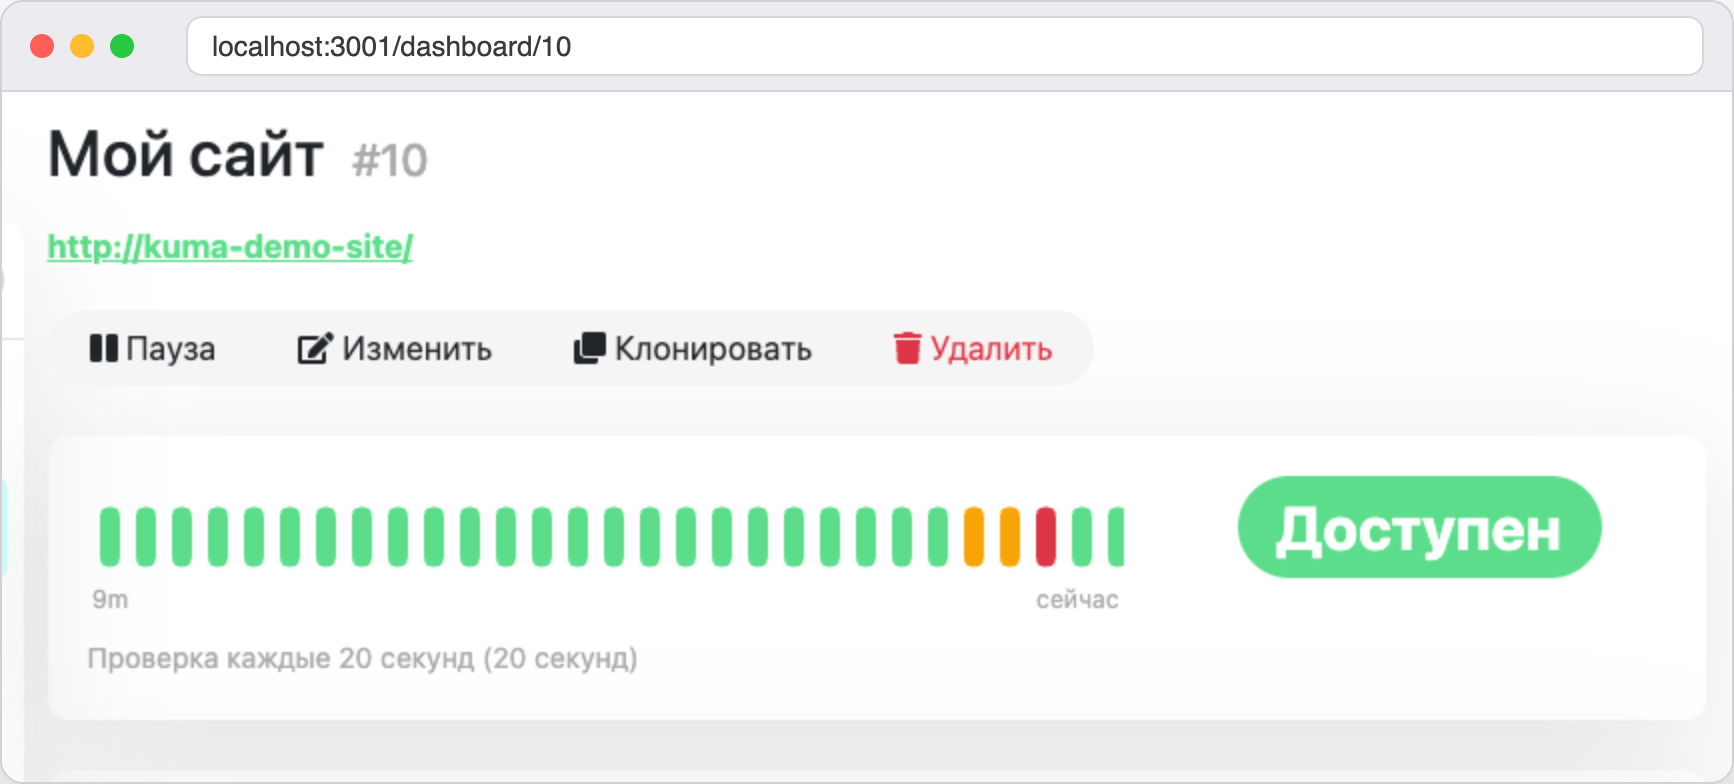
Kuma does not declare an outage right away. It draws the first two failed checks as orange bars, and only the third one in a row turns red. In our test the **Down** status appeared about a minute after the container was stopped, and until that moment not a single notification had been sent. Now start the website again.

```bash
docker start kuma-demo-site
```

On the nearest check the monitor returned to **Up**, and a recovery entry appeared in the log. In our test this happened just a few seconds after the container was started.

<figure><img src="https://docs.f3cloud.com/img/kuma-outage-recovery.png" alt="The check bar of the My site monitor, two orange bars, one red and then green ones"><figcaption><p>Orange bars, a red outage and a green recovery</p></figcaption></figure>

The error text depends on exactly how the service stopped responding. In our two stops it was `connect ECONNREFUSED 172.21.0.3:80` and `connect EHOSTUNREACH 172.21.0.3:80`.

***

## Step 7. Publish a status page

A **status page** is a public page where visitors see the state of your services without logging in to the dashboard. It is handy to show to clients so that they do not write to support at every outage.

1. In the top menu, click **Status Pages**, then <kbd>New Status Page</kbd>.
2. In the **Name** field, enter a title, for example `Service status`.
3. In the **Slug** field, enter a part of the address, for example `main`. The page will open at the address `/status/main`. A slug can contain only lowercase Latin letters, digits and hyphens.
4. Click <kbd>Next</kbd>.

The editor will open. The page settings are on the left and the preview is on the right.

* **Description** and **Footer Text** – the texts at the top and bottom of the page. They support Markdown.
* **Refresh Interval** – how often the page reloads itself, 300 seconds by default.
* **Theme** – light, dark or the same as the visitor's system.
* **Domain Names** – the addresses on which exactly this page is shown, which lets you keep several pages on one Kuma.

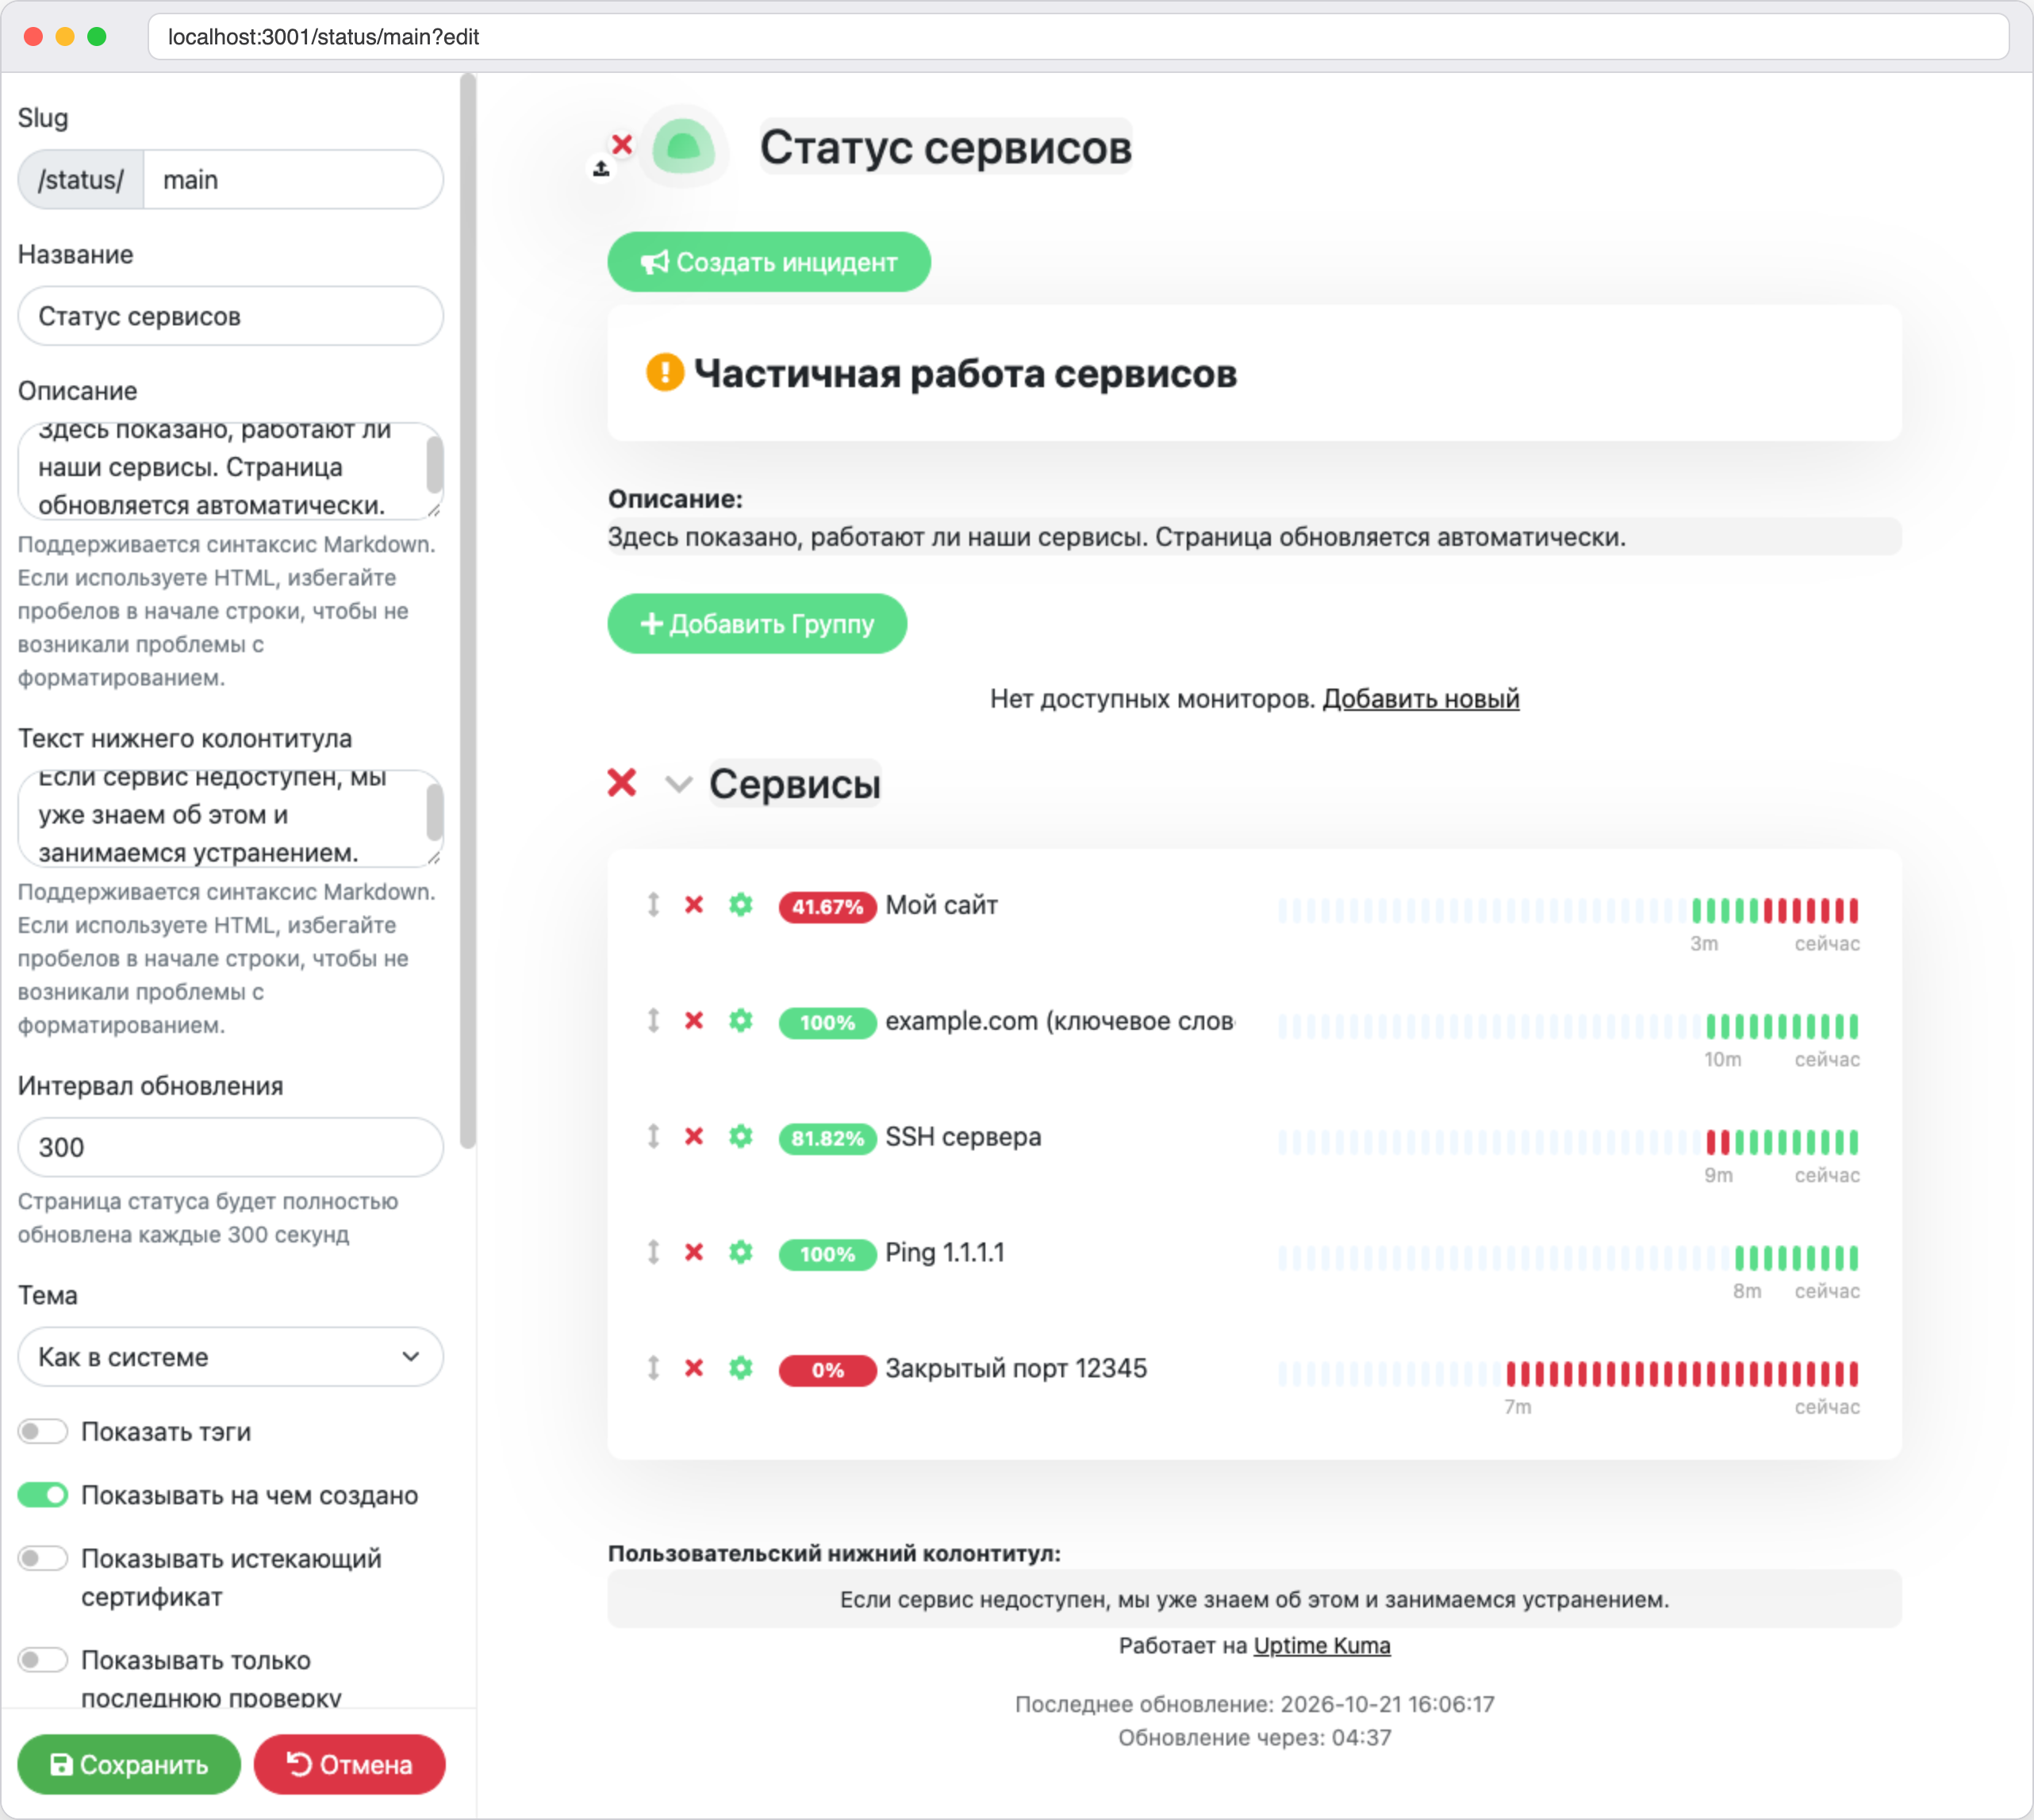
Select monitors in the **Add a monitor** list and click <kbd>Save</kbd>. Monitors can be arranged into groups with the **Add Group** button. On our page all the monitors ended up in the **Services** group, and we even added the closed port monitor there to show what an outage looks like for visitors.

<figure><img src="https://docs.f3cloud.com/img/kuma-status-edit.png" alt="The status page editor in Uptime Kuma, settings on the left, five added monitors on the right"><figcaption><p>The status page editor</p></figcaption></figure>

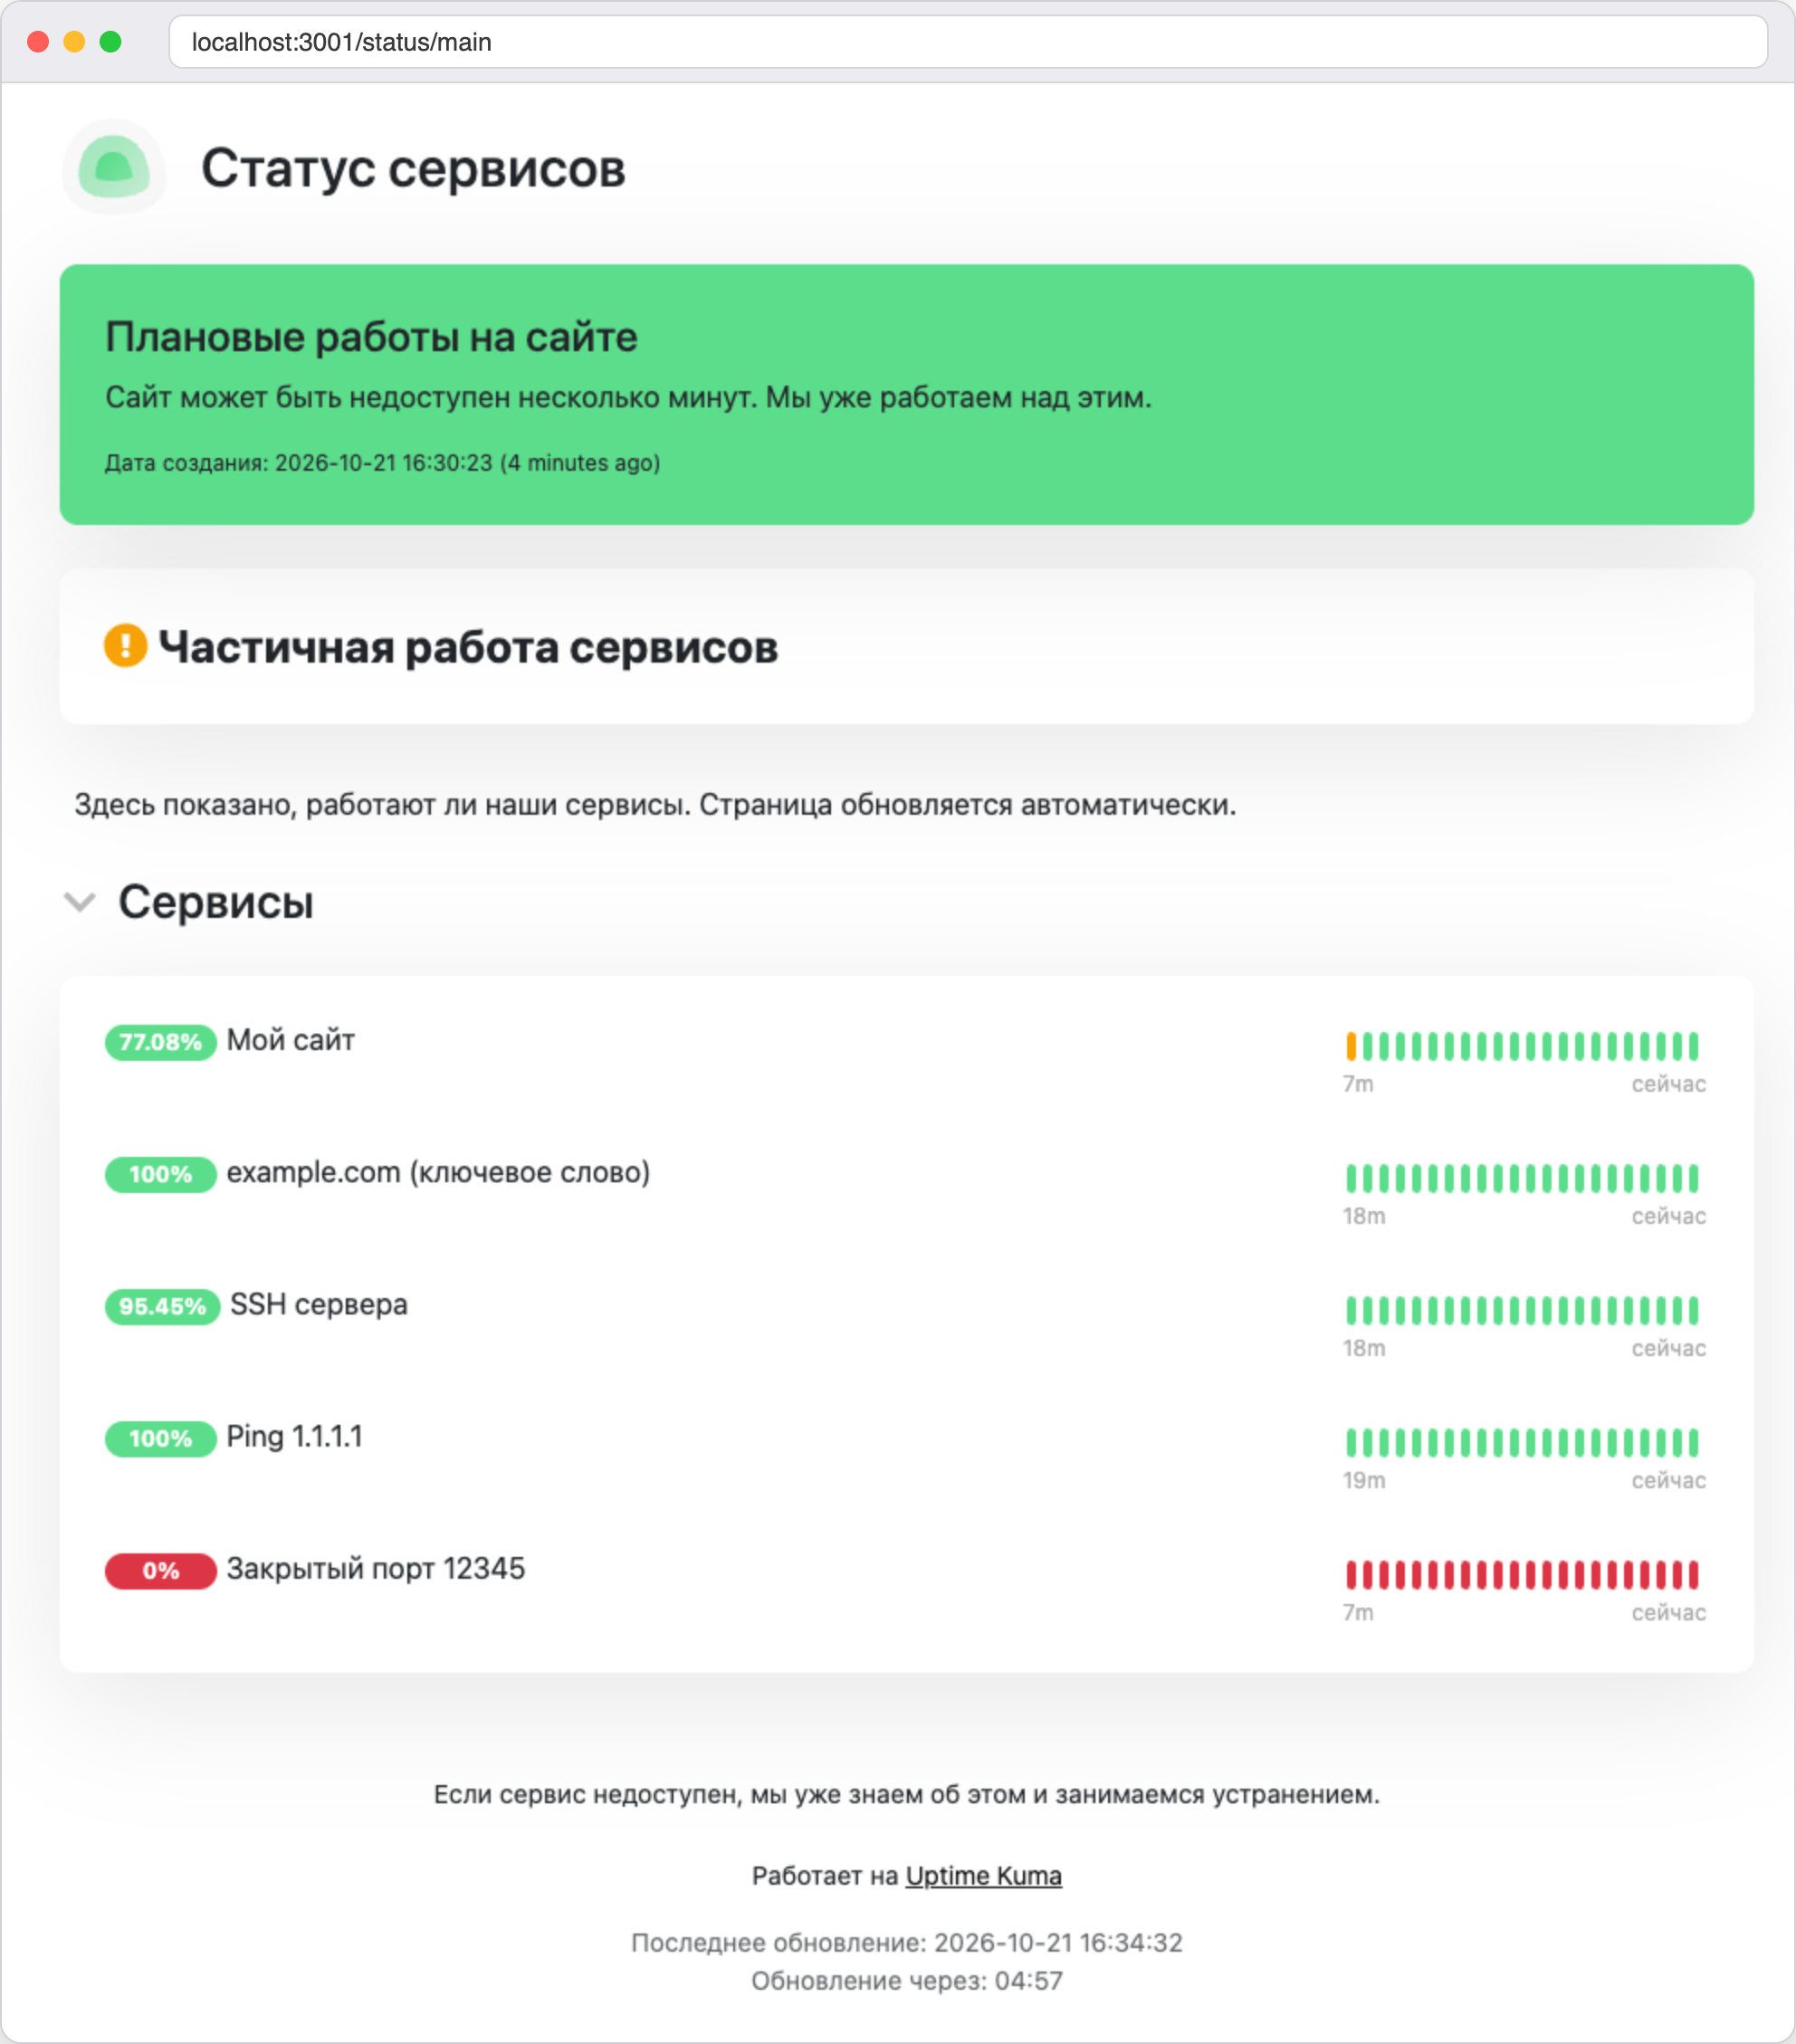
Visitors see the page without the control buttons. We checked this by opening it in a separate window without being logged in to Kuma. If some of the monitors are down, the heading **Partially Degraded Service** appears at the top automatically.

If you need to explain the reason for an outage, click <kbd>Create Incident</kbd> in the editor. Fill in the **Title** and **Content**, click <kbd>Post</kbd> and then save the page, and the message will appear above the list of services. Later it can be edited, resolved or deleted, and the incident has the **Edit**, **Resolve** and **Delete** buttons for that.

<figure><img src="https://docs.f3cloud.com/img/kuma-status-page.png" alt="A public status page, a message about planned work at the top, below it the heading Partially Degraded Service and five monitors"><figcaption><p>The status page as a visitor sees it</p></figcaption></figure>

### How to show the page to visitors

While Kuma listens only on `127.0.0.1`, only you can see the page, through the tunnel. There are two ways to let others see it.

* **Open the port directly.** In `compose.yaml`, replace the line `"127.0.0.1:3001:3001"` with `"3001:3001"` and run `docker compose up -d`. The page will become available at `http://server-IP:3001/status/main`, but together with it the dashboard login window will also open to the internet over unencrypted HTTP. We checked that the port opens after such a replacement.
* **Put Kuma behind nginx with a domain and HTTPS.** This is the main option for real use. Point a domain to the server using the [guide](https://docs.f3cloud.com/en/vps/domain-to-vps.md), install [nginx](https://docs.f3cloud.com/en/web/nginx-installation.md) and get a [free certificate](https://docs.f3cloud.com/en/web/lets-encrypt-ssl-nginx-apache.md). Kuma works over WebSocket, so nginx has to pass two more headers, `Upgrade` and `Connection`. Ready-made configuration examples are on the [Reverse Proxy](https://github.com/louislam/uptime-kuma/wiki/Reverse-Proxy) page in the Uptime Kuma wiki. The same page says that to show different pages by domain, the proxy must pass Kuma the `Host` or `X-Forwarded-Host` header. We did not build this setup on the test server because ports 80 and 443 are taken by another service there.

> **The page does not update instantly.**
>
> According to the Uptime Kuma wiki, the status page caches results for 5 minutes and updates itself once every 5 minutes. So it lags behind the dashboard, and that is normal.

***

## Step 8. Set up notifications

The dashboard is only useful when you are looking at it, while notifications arrive on their own. Kuma can send them to dozens of services. The list of types includes **Telegram**, **Discord**, **Slack**, **Email (SMTP)**, **Webhook**, **Apprise** and many others. We will go through the form using Telegram as an example.

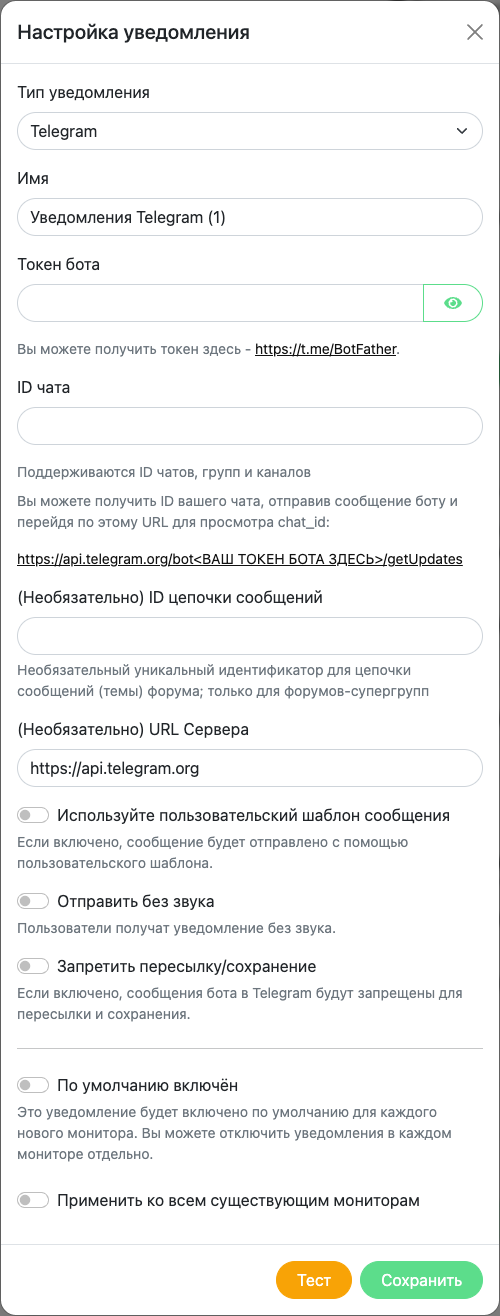
Open the profile menu in the top right corner, choose **Settings**, then **Notifications** and click <kbd>Set Up Notification</kbd>. In the **Notification Type** list, Telegram is selected by default.

<figure><img src="https://docs.f3cloud.com/img/kuma-telegram-form.png" alt="The Telegram notification setup form in Uptime Kuma with the bot token, chat ID, message thread ID and server URL fields"><figcaption><p>The Telegram notification form</p></figcaption></figure>

The form has these fields.

* **Friendly Name** – the name of the notification, by which you will find it in the lists.
* **Bot Token** – the key of your bot. It is issued by the @BotFather bot, and there is a link to it under the field. The token is entered in hidden form, and the eye icon shows it.
* **Chat ID** – the identifier of the chat, group or channel the bot will write to. Kuma hints at how to find it. You need to send a message to the bot and open `https://api.telegram.org/bot<YOUR BOT TOKEN HERE>/getUpdates` in the browser, and the response will contain `chat_id`.
* **Message Thread ID** – an optional field for forum topics. It suits only supergroups with topics.
* **Server Url** – an optional field, which contains `https://api.telegram.org` by default. It is usually not changed.
* **Use custom message template** – turn it on if you want to write the notification text yourself.
* **Send Silently** – messages arrive without a sound.
* **Protect Forwarding/Saving** – Telegram will not allow forwarding or saving the bot's messages.
* **Default enabled** – the notification will be turned on for every new monitor.
* **Apply on all existing monitors** – attaches the notification to all the monitors that already exist.

The <kbd>Test</kbd> button sends a test message, and <kbd>Save</kbd> saves the notification. We did not create a real bot for this article, so we only went through the Telegram form field by field.

A saved notification has to be attached to monitors. Open a monitor, click <kbd>Edit</kbd> and find the **Notifications** block on the right. It lists all the notifications you have created, with switches. Turn on the one you need and click <kbd>Save</kbd>. If you ticked **Default enabled**, the switch will already be on in new monitors.

We checked how notifications arrive using the **Webhook** type, which sends a request to any address. For every stop and start of the website container exactly two messages arrived, the first on the switch to **Down** and the second on recovery. The orange checks with retries did not trigger notifications. Kuma composes the notification text itself.

```text
[My site] [🔴 Down] connect EHOSTUNREACH 172.21.0.3:80
[My site] [✅ Up] 200 - OK
```

If you want Kuma to remind you about a prolonged outage, the monitor form has the **Resend Notification if Down X times consecutively** field, and resending is disabled by default.

> **Planned work without extra notifications.**
>
> The profile menu has the **Maintenance** item. According to the Uptime Kuma wiki, no notifications are sent for the selected monitors during a maintenance window, and a message about the work can be shown on status pages. Create such a window before you turn a service off for an update.

***

## Step 9. Set up backups

Everything Kuma knows lies in the `/opt/kuma/data` folder. This is the administrator account, the monitors, the notifications, the status pages and the check history. Uptime Kuma 2 removed the old export of settings to JSON, and in the guide for migrating to the second version the developers state directly that copying the `data` folder remains the only supported backup method.

It has to be copied carefully. While Kuma is running, the SQLite database keeps fresh changes in separate files `kuma.db-wal` and `kuma.db-shm`, and we saw them next to `kuma.db` in a running Kuma. If you copy the files on the fly, the copy may turn out to be incomplete. That is why the script below stops Kuma for a few seconds, archives the folder and starts Kuma again. After the stop, only a single `kuma.db` file remains in the folder.

```bash
nano /opt/kuma/backup.sh
```

```bash
#!/bin/sh
# Stops Kuma, archives the data folder and starts Kuma again
cd /opt/kuma || exit 1
mkdir -p backups
docker compose stop
tar -czf "backups/kuma-$(date +%F-%H%M).tar.gz" data
docker compose start
# Keeps the 7 latest archives
ls -1t backups/kuma-*.tar.gz | tail -n +8 | xargs -r rm --
```

Make the script executable and run it manually.

```bash
chmod +x /opt/kuma/backup.sh
/opt/kuma/backup.sh
ls -lh /opt/kuma/backups
```

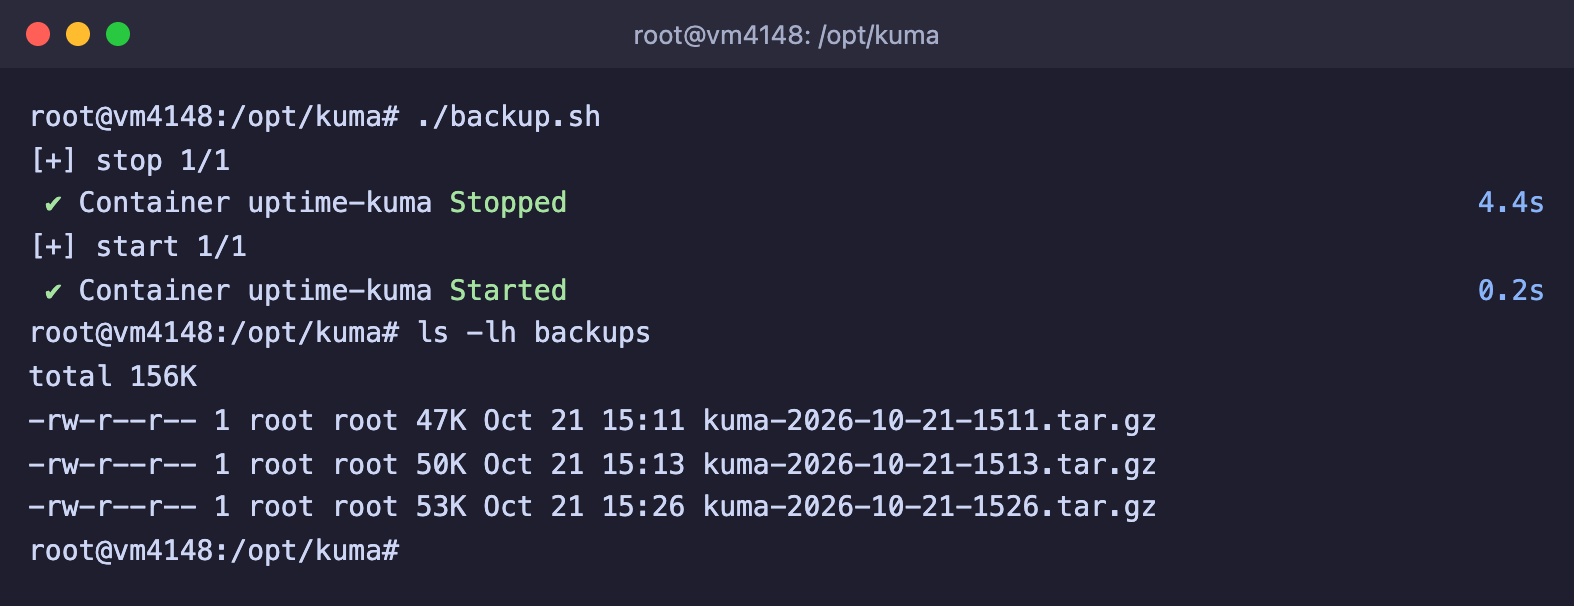
<figure><img src="https://docs.f3cloud.com/img/kuma-backup.png" alt="Running backup.sh, the uptime-kuma container is stopped and started, kuma archives are in the backups folder"><figcaption><p>The script stopped Kuma, made an archive and started it again</p></figcaption></figure>

On our server stopping and starting together took about 5 seconds, and the archive with five monitors weighed about 50 KB. During that time Kuma does not perform checks, so there will be a short gap in the chart.

To make copies automatically, add a job to the schedule, for example for 4 a.m. A file in the `/etc/cron.d` folder is simpler than editing the general schedule.

```bash
echo "0 4 * * * root /opt/kuma/backup.sh" > /etc/cron.d/kuma-backup
```

We checked the schedule by temporarily setting the run to every minute, and two new archives appeared within two minutes. You can read more about scheduling in the article about [cron](https://docs.f3cloud.com/en/linux/cron-linux.md). Copies on the same server will not help if the server itself is lost, so from time to time take the archives to your own machine, for example with the [rsync](https://docs.f3cloud.com/en/linux/rsync-linux.md) command.

### How to restore Kuma from a backup

Stop Kuma, move the current `data` folder aside and unpack the archive. Instead of the archive name, put the file you need from the `backups` folder.

```bash
cd /opt/kuma
docker compose down
mv data data.old
tar -xzf backups/kuma-2026-10-21-1526.tar.gz
docker compose up -d
```

We checked the restore separately. We unpacked the archive into a clean folder, started a second Kuma from it and logged in with the same username and password. The monitors with their check history, the status page with the incident and the configured notification were all in place.

***

## Step 10. Update Uptime Kuma

New versions of Kuma come out regularly and fix bugs and vulnerabilities. For example, the release notes for 2.5.6 on GitHub include both a bug fix and security updates of dependencies. Updating in Docker comes down to downloading a fresh image and creating the container again. The data stays in the `data` folder and is not affected. Before updating, make a backup as in Step 9.

```bash
cd /opt/kuma
docker compose pull
docker compose up -d --force-recreate
```

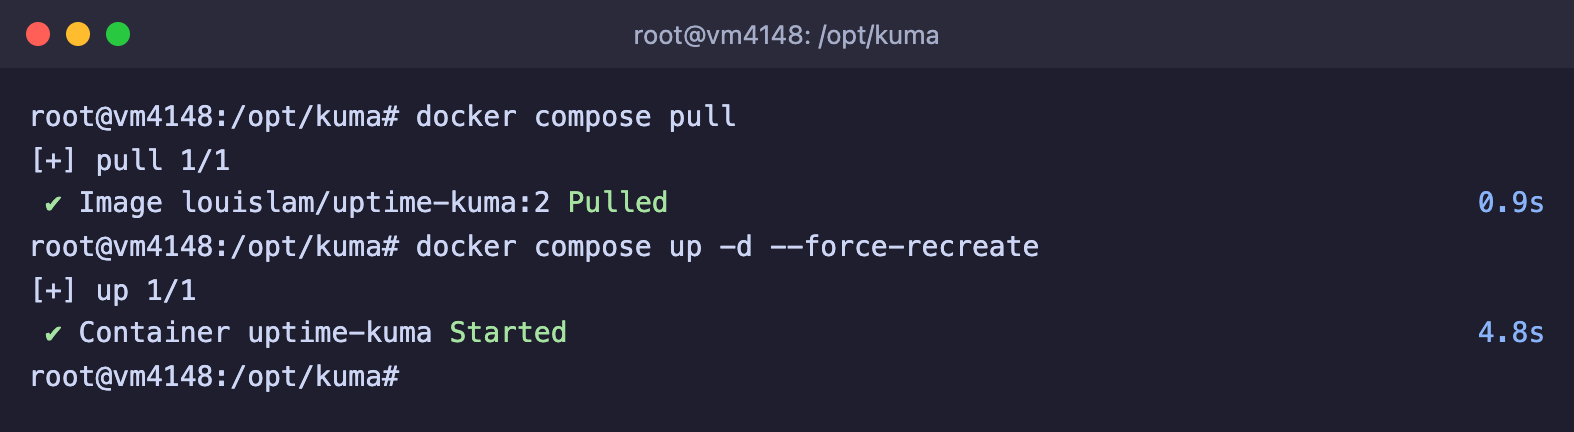
The first command downloads the fresh image for the `2` tag, and the second creates the container again.

<figure><img src="https://docs.f3cloud.com/img/kuma-update.png" alt="The docker compose pull and docker compose up -d --force-recreate commands, the image is received, the uptime-kuma container is started"><figcaption><p>The image is updated, the container is created again</p></figcaption></figure>

You can see the installed version in the dashboard, in the profile menu, under **Settings**, then **About**. We checked the update on a separate instance. First we started Uptime Kuma 2.4.0 with the `louislam/uptime-kuma:2.4.0` image, created an administrator and a monitor in it, then replaced the tag with `2` and ran the commands above. After that **About** showed version 2.5.6, the administrator logged in with their password, and the monitor stayed in place together with its check history.

> **Migrate from version 1 by following the guide.**
>
> If you already run Uptime Kuma 1, do not update it by simply changing the tag. The developers' wiki has a separate guide for migrating to the second version. It says to make a copy of the `data` folder first, and the migration itself can take a long time and must not be interrupted. We did not test this migration.

If you need a specific version and not the latest one in the branch, specify it in `image`, for example `louislam/uptime-kuma:2.5.6`. This is how we started Uptime Kuma 2.4.0 in the update check.

***

## Useful commands

```bash
docker compose ps                         # container status
docker logs uptime-kuma                   # Kuma log
docker compose stop                       # stop Kuma, the data stays
docker compose start                      # start Kuma again
docker compose pull                       # download the fresh image
docker compose up -d --force-recreate     # recreate the container on the new image
docker exec -it uptime-kuma npm run reset-password   # reset the administrator password
docker stats --no-stream uptime-kuma      # memory and CPU of the container
```

All the commands are run in the `/opt/kuma` folder.

***

## Frequently asked questions

<details>

<summary>The monitor for 127.0.0.1:22 shows Down and Connection failed</summary>

Inside the container, the address `127.0.0.1` means the container itself, not the server. We checked this with a command from inside the container, and it was refused.

```bash
docker exec uptime-kuma bash -c "echo > /dev/tcp/127.0.0.1/22"
```

The response will be `Connection refused`. In the monitor's **Hostname** field, enter `host.docker.internal`. If you did not add `extra_hosts` to `compose.yaml`, do it as in Step 1 and run `docker compose up -d`. Compose will recreate the container, and the data will not be harmed. After that the monitor turned green for us.

</details>

<details>

<summary>ERR_CONNECTION_REFUSED when opening localhost:3001</summary>

The browser found nothing on the port of your computer. Check three things.

1. The terminal window with the `ssh -L` command must be open, because the tunnel works only while it is open.
2. The port in the address must match the first port in the `ssh -L` command.
3. The container on the server must be running, which the `docker compose ps` command shows.

You also will not be able to open the dashboard at `http://server-IP:3001`. The port listens only on `127.0.0.1`, and for us such a connection simply hung until the timeout.

</details>

<details>

<summary>Cannot connect to the socket server. [Error: xhr poll error] Reconnecting...</summary>

The dashboard has lost its connection to Kuma. We got this message when we stopped the container with the `docker compose stop` command while the dashboard was open. After `docker compose start` the dashboard reconnected by itself. Under the message Kuma adds a hint, "Using a Reverse Proxy? Check how to config it for WebSocket". If Kuma is behind nginx, the cause is usually missing WebSocket headers, and a configuration example is on the [Reverse Proxy](https://github.com/louislam/uptime-kuma/wiki/Reverse-Proxy) page in the Uptime Kuma wiki.

</details>

<details>

<summary>Request failed with status code 404</summary>

The website responded, but with a code that is not among the allowed ones. By default, codes 200–299 are considered successful. We got this error while checking the non-existent page `https://example.com/missing`. Check the address in the **URL** field. If the website responds with a different code and that is intended, add it to the **Accepted Status Codes** field in the monitor form.

</details>

<details>

<summary>certificate has expired and self-signed certificate</summary>

The website has a problem with its HTTPS certificate. We got `certificate has expired` on the test website `expired.badssl.com` and `self-signed certificate` on `self-signed.badssl.com`. First, fix the certificate on the website itself if you can. If you need to watch a website that you trust but whose certificate is deliberately self-signed, turn on the **Ignore TLS/SSL errors for HTTPS websites** checkbox in the monitor form. After that the monitor with the expired certificate started showing `200 - OK` for us.

</details>

<details>

<summary>200 - OK, but keyword is not in [...]</summary>

The website responded, but the word from the **Keyword** field is not on the page. We got this error by entering `Hello world` for example.com. Kuma searches for the word with the letter case taken into account and shows the beginning of the page it received in square brackets. Compare the word with the page and correct it in the monitor form.

</details>

<details>

<summary>getaddrinfo ENOTFOUND name</summary>

Kuma could not turn the name into an address. Check whether there is a typo in the name. If you are checking a container by name, like `kuma-demo-site` in Step 6, make sure it is running and connected to the same network as Kuma. We got this error for a non-existent domain, and also on a copy of Kuma that ran in a different Docker network and did not see the `kuma-demo-site` container.

</details>

<details>

<summary>Incorrect username or password. How to reset the password</summary>

We ran into this message when we logged in to Kuma with the old password after a reset. If you have forgotten the password, you can reset it with a command on the server.

```bash
docker exec -it uptime-kuma npm run reset-password
```

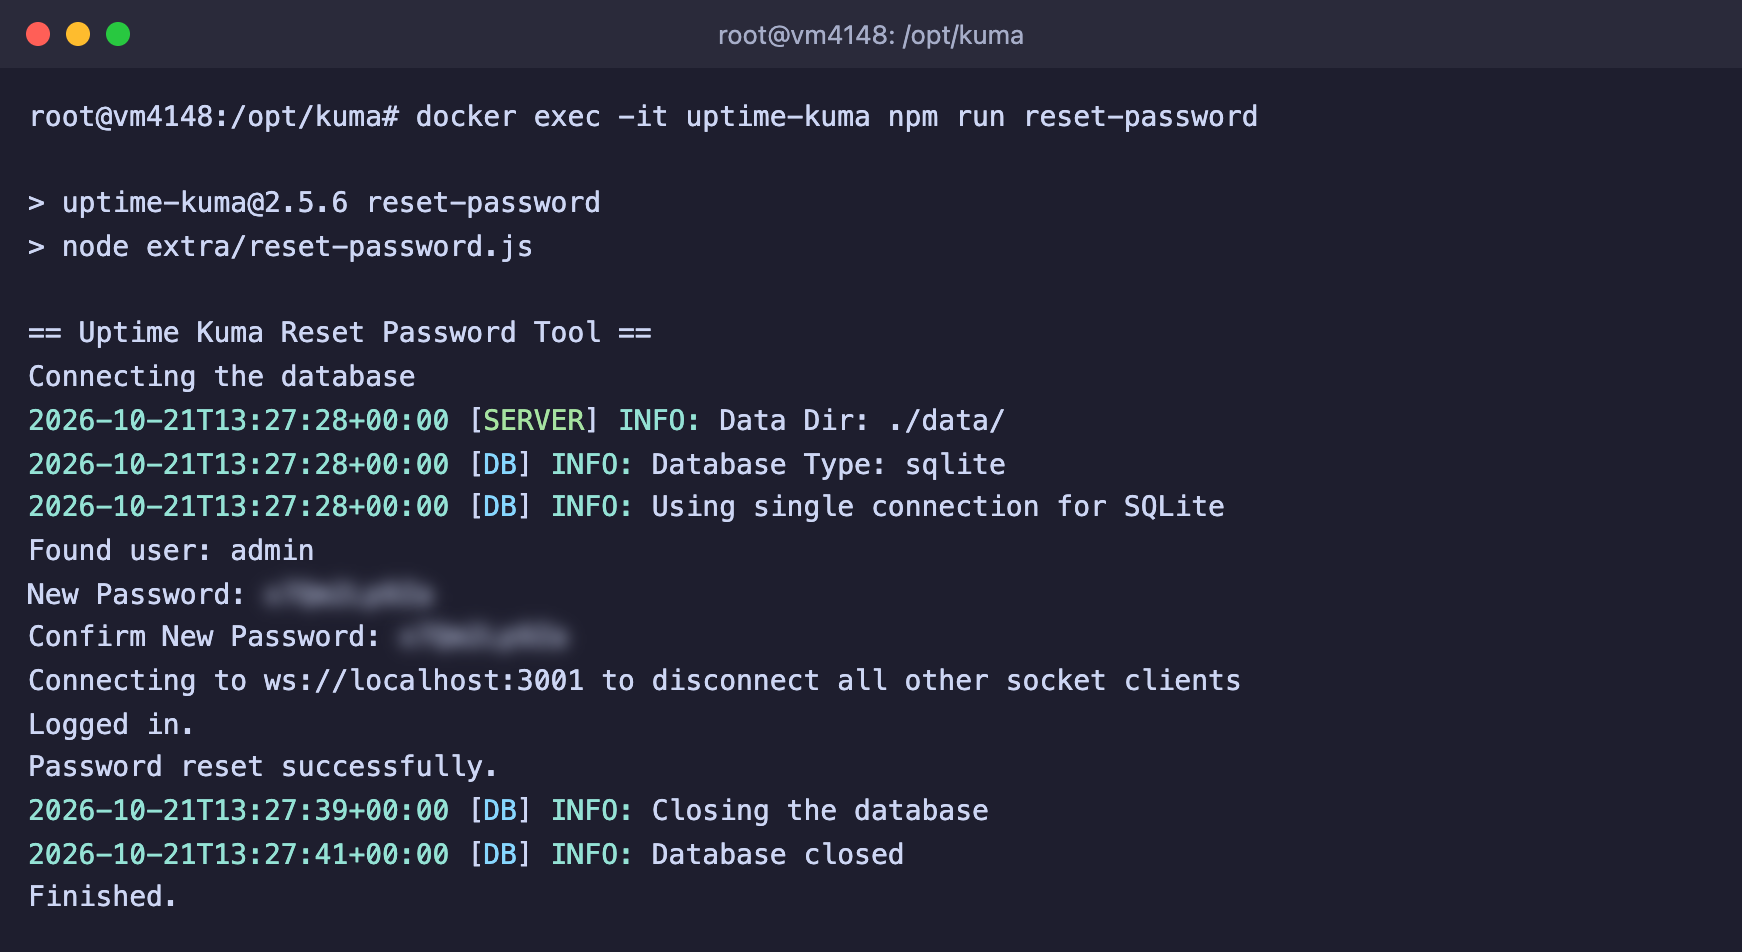
The program will find the user, ask for the new password twice and report `Password reset successfully.`. The password is shown on the screen as you type it, so do this when nobody is watching you.

<figure><img src="https://docs.f3cloud.com/img/kuma-reset-password.png" alt="Resetting the password with the npm run reset-password command, the admin user is found, the password is reset"><figcaption><p>Resetting the administrator password</p></figcaption></figure>

</details>

<details>

<summary>Kuma shows Down, but the website opens in my browser</summary>

Kuma checks the website from its own server, so the response may differ from the one you see. The developers advise checking availability directly from the container. The image already has `curl`.

```bash
docker exec -it uptime-kuma bash
curl -I https://example.com
```

If you get the same error here, the problem is in the server's network, firewall or DNS, not in Kuma itself.

</details>

***

## Our resources

**Telegram channel:** [https://t.me/f3cloud_news](https://t.me/f3cloud_news)\
**F3 Cloud:** [https://f3cloud.com](https://f3cloud.com/en)